
Advertisement
Market Cool On Philly Shipyard ASA's (OB:PHLY) Revenues Pushing Shares 27% Lower

Philly Shipyard ASA (OB:PHLY) shares have had a horrible month, losing 27% after a relatively good period beforehand. The drop over the last 30 days has capped off a tough year for shareholders, with the share price down 15% in that time.
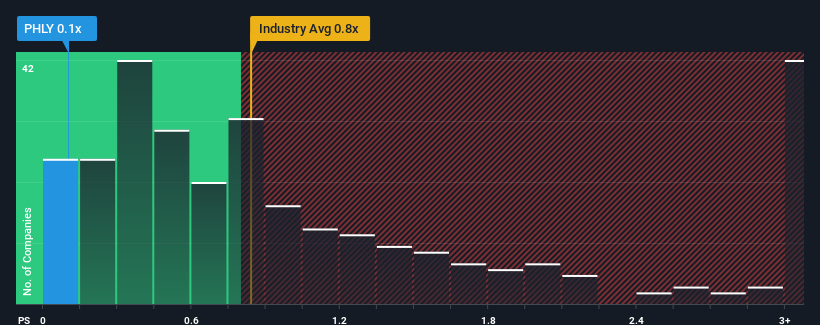
Since its price has dipped substantially, it would be understandable if you think Philly Shipyard is a stock with good investment prospects with a price-to-sales ratios (or "P/S") of 0.1x, considering almost half the companies in Norway's Machinery industry have P/S ratios above 1.1x. Nonetheless, we'd need to dig a little deeper to determine if there is a rational basis for the reduced P/S.
See our latest analysis for Philly Shipyard
How Philly Shipyard Has Been Performing
The revenue growth achieved at Philly Shipyard over the last year would be more than acceptable for most companies. Perhaps the market is expecting this acceptable revenue performance to take a dive, which has kept the P/S suppressed. If that doesn't eventuate, then existing shareholders have reason to be optimistic about the future direction of the share price.
We don't have analyst forecasts, but you can see how recent trends are setting up the company for the future by checking out our free report on Philly Shipyard's earnings, revenue and cash flow.Do Revenue Forecasts Match The Low P/S Ratio?
Philly Shipyard's P/S ratio would be typical for a company that's only expected to deliver limited growth, and importantly, perform worse than the industry.
Retrospectively, the last year delivered a decent 13% gain to the company's revenues. While this performance is only fair, the company was still able to deliver immense revenue growth over the last three years. Accordingly, shareholders would have been over the moon with those medium-term rates of revenue growth.
This is in contrast to the rest of the industry, which is expected to grow by 17% over the next year, materially lower than the company's recent medium-term annualised growth rates.
In light of this, it's peculiar that Philly Shipyard's P/S sits below the majority of other companies. It looks like most investors are not convinced the company can maintain its recent growth rates.
What Does Philly Shipyard's P/S Mean For Investors?
Philly Shipyard's recently weak share price has pulled its P/S back below other Machinery companies. We'd say the price-to-sales ratio's power isn't primarily as a valuation instrument but rather to gauge current investor sentiment and future expectations.
We're very surprised to see Philly Shipyard currently trading on a much lower than expected P/S since its recent three-year growth is higher than the wider industry forecast. When we see robust revenue growth that outpaces the industry, we presume that there are notable underlying risks to the company's future performance, which is exerting downward pressure on the P/S ratio. It appears many are indeed anticipating revenue instability, because the persistence of these recent medium-term conditions would normally provide a boost to the share price.
There are also other vital risk factors to consider and we've discovered 3 warning signs for Philly Shipyard (1 doesn't sit too well with us!) that you should be aware of before investing here.
If these risks are making you reconsider your opinion on Philly Shipyard, explore our interactive list of high quality stocks to get an idea of what else is out there.
New: Manage All Your Stock Portfolios in One Place
We've created the ultimate portfolio companion for stock investors, and it's free.
• Connect an unlimited number of Portfolios and see your total in one currency
• Be alerted to new Warning Signs or Risks via email or mobile
• Track the Fair Value of your stocks
Have feedback on this article? Concerned about the content? Get in touch with us directly. Alternatively, email editorial-team (at) simplywallst.com.
This article by Simply Wall St is general in nature. We provide commentary based on historical data and analyst forecasts only using an unbiased methodology and our articles are not intended to be financial advice. It does not constitute a recommendation to buy or sell any stock, and does not take account of your objectives, or your financial situation. We aim to bring you long-term focused analysis driven by fundamental data. Note that our analysis may not factor in the latest price-sensitive company announcements or qualitative material. Simply Wall St has no position in any stocks mentioned.
About OB:PHLY
Philly Shipyard
Operates a commercial shipyard that builds and repairs vessels for the United States Jones Act market and government.
Flawless balance sheet slight.
Market Insights

Advertisement
Community Narratives

Apple: A Dying Star with an Overpriced Valuation
Fair Value US$177.34|20.1% overvalued
IN
Community Contributor
Avino a case for USD$20 per share within 5 years (assuming $3,500 gold, $100 silver and $4 copper).
Fair Value CA$26.79|87.5% undervalued
AG
Community Contributor
Riding the Defense Boom RENK Sees Revenue Climb at 15% CAGR by FY 2029
Fair Value €69.87|20.5% undervalued
CH
Community Contributor