
Advertisement
- Netherlands
- /
- Electronic Equipment and Components
- /
- ENXTAM:NEDAP
Is N.V. Nederlandsche Apparatenfabriek Nedap's (AMS:NEDAP) High P/E Ratio A Problem For Investors?

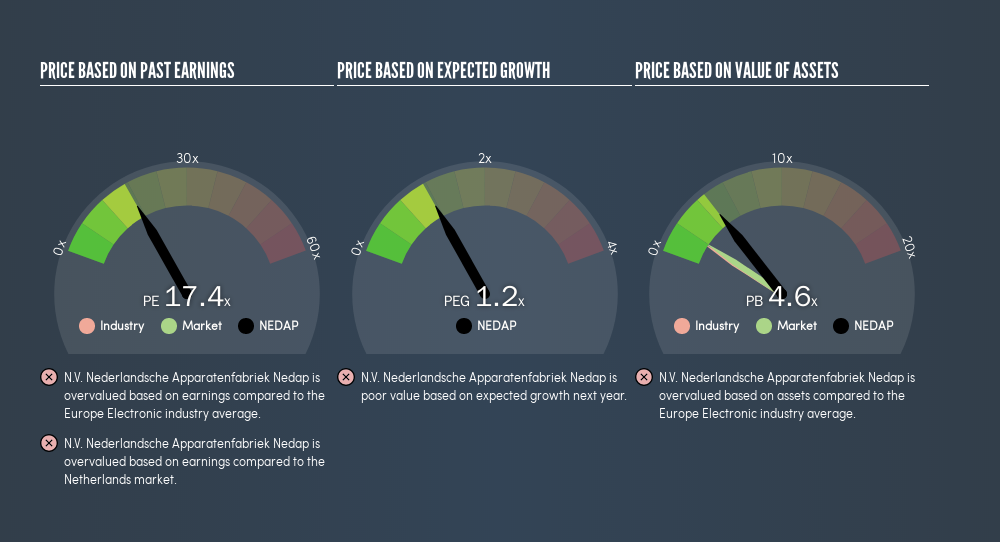
The goal of this article is to teach you how to use price to earnings ratios (P/E ratios). We'll show how you can use N.V. Nederlandsche Apparatenfabriek Nedap's (AMS:NEDAP) P/E ratio to inform your assessment of the investment opportunity. Based on the last twelve months, N.V. Nederlandsche Apparatenfabriek Nedap's P/E ratio is 17.38. In other words, at today's prices, investors are paying €17.38 for every €1 in prior year profit.
Want to participate in a short research study? Help shape the future of investing tools and you could win a $250 gift card!
View our latest analysis for N.V. Nederlandsche Apparatenfabriek Nedap
How Do I Calculate A Price To Earnings Ratio?
The formula for P/E is:
Price to Earnings Ratio = Share Price ÷ Earnings per Share (EPS)
Or for N.V. Nederlandsche Apparatenfabriek Nedap:
P/E of 17.38 = €46.3 ÷ €2.66 (Based on the trailing twelve months to December 2018.)
Is A High Price-to-Earnings Ratio Good?
A higher P/E ratio implies that investors pay a higher price for the earning power of the business. All else being equal, it's better to pay a low price -- but as Warren Buffett said, 'It's far better to buy a wonderful company at a fair price than a fair company at a wonderful price.'
How Growth Rates Impact P/E Ratios
P/E ratios primarily reflect market expectations around earnings growth rates. That's because companies that grow earnings per share quickly will rapidly increase the 'E' in the equation. That means unless the share price increases, the P/E will reduce in a few years. So while a stock may look expensive based on past earnings, it could be cheap based on future earnings.
N.V. Nederlandsche Apparatenfabriek Nedap's 99% EPS improvement over the last year was like bamboo growth after rain; rapid and impressive. Even better, EPS is up 56% per year over three years. So you might say it really deserves to have an above-average P/E ratio.
Does N.V. Nederlandsche Apparatenfabriek Nedap Have A Relatively High Or Low P/E For Its Industry?
One good way to get a quick read on what market participants expect of a company is to look at its P/E ratio. As you can see below N.V. Nederlandsche Apparatenfabriek Nedap has a P/E ratio that is fairly close for the average for the electronic industry, which is 17.1.
Its P/E ratio suggests that N.V. Nederlandsche Apparatenfabriek Nedap shareholders think that in the future it will perform about the same as other companies in its industry classification. The company could surprise by performing better than average, in the future. Checking factors such as the tenure of the board and management could help you form your own view on if that will happen.
Remember: P/E Ratios Don't Consider The Balance Sheet
One drawback of using a P/E ratio is that it considers market capitalization, but not the balance sheet. Thus, the metric does not reflect cash or debt held by the company. In theory, a company can lower its future P/E ratio by using cash or debt to invest in growth.
Such spending might be good or bad, overall, but the key point here is that you need to look at debt to understand the P/E ratio in context.
So What Does N.V. Nederlandsche Apparatenfabriek Nedap's Balance Sheet Tell Us?
N.V. Nederlandsche Apparatenfabriek Nedap's net debt is 5.6% of its market cap. It would probably trade on a higher P/E ratio if it had a lot of cash, but I doubt it is having a big impact.
The Bottom Line On N.V. Nederlandsche Apparatenfabriek Nedap's P/E Ratio
N.V. Nederlandsche Apparatenfabriek Nedap has a P/E of 17.4. That's around the same as the average in the NL market, which is 16.8. When you consider the impressive EPS growth last year (along with some debt), it seems the market has questions about whether rapid EPS growth will be sustained.
When the market is wrong about a stock, it gives savvy investors an opportunity. People often underestimate remarkable growth -- so investors can make money when fast growth is not fully appreciated. So this free report on the analyst consensus forecasts could help you make a master move on this stock.
You might be able to find a better buy than N.V. Nederlandsche Apparatenfabriek Nedap. If you want a selection of possible winners, check out this free list of interesting companies that trade on a P/E below 20 (but have proven they can grow earnings).
We aim to bring you long-term focused research analysis driven by fundamental data. Note that our analysis may not factor in the latest price-sensitive company announcements or qualitative material.
If you spot an error that warrants correction, please contact the editor at editorial-team@simplywallst.com. This article by Simply Wall St is general in nature. It does not constitute a recommendation to buy or sell any stock, and does not take account of your objectives, or your financial situation. Simply Wall St has no position in the stocks mentioned. Thank you for reading.
About ENXTAM:NEDAP
Nedap
Develops and manufactures electronic equipment and software in the Netherlands, Germany, rest of Europe, North America, and internationally.
Flawless balance sheet and slightly overvalued.
Similar Companies
Market Insights


Advertisement
Community Narratives
The Future of Drug Testing? Fingerprint Tech Shows Serious Promise
Fair Value US$2.98|40.3% undervalued
JO
Community Contributor
Suncorp’s Next Chapter: Insurance-Only and Ready to Grow
Fair Value AU$22.83|8.8% undervalued
RO
Community Contributor
Thyssenkrupp Nucera Will Achieve Double-Digit Profits by 2030 Boosted by Hydrogen Growth
Fair Value €14.40|31.3% undervalued
CH
Community Contributor
Tesla’s Nvidia Moment – The AI & Robotics Inflection Point
Fair Value US$384.84|18.1% undervalued
BL
Community Contributor