
Advertisement
Key Insights
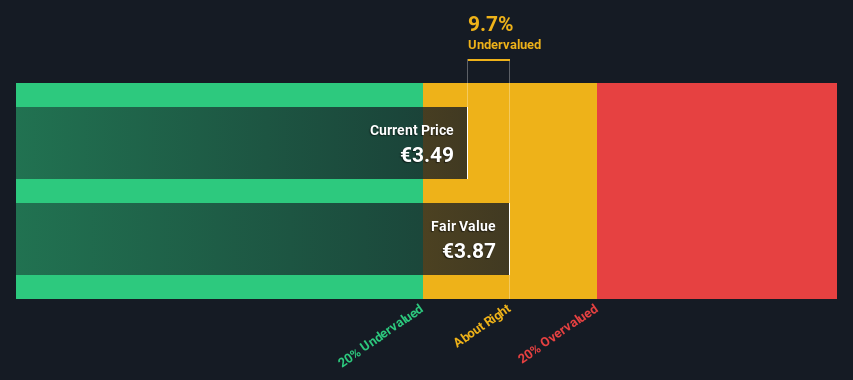
- Using the Dividend Discount Model, Ctac fair value estimate is €3.87
- With €3.49 share price, Ctac appears to be trading close to its estimated fair value
- Ctac's peers seem to be trading at a lower discount to fair value based onthe industry average of 8.3%
How far off is Ctac N.V. (AMS:CTAC) from its intrinsic value? Using the most recent financial data, we'll take a look at whether the stock is fairly priced by taking the forecast future cash flows of the company and discounting them back to today's value. We will use the Discounted Cash Flow (DCF) model on this occasion. Before you think you won't be able to understand it, just read on! It's actually much less complex than you'd imagine.
We would caution that there are many ways of valuing a company and, like the DCF, each technique has advantages and disadvantages in certain scenarios. For those who are keen learners of equity analysis, the Simply Wall St analysis model here may be something of interest to you.
See our latest analysis for Ctac
The Calculation
We have to calculate the value of Ctac slightly differently to other stocks because it is a it company. In this approach dividends per share (DPS) are used, as free cash flow is difficult to estimate and often not reported by analysts. Unless a company pays out the majority of its FCF as a dividend, this method will typically underestimate the value of the stock. We use the Gordon Growth Model, which assumes dividend will grow into perpetuity at a rate that can be sustained. The dividend is expected to grow at an annual growth rate equal to the 5-year average of the 10-year government bond yield of 0.8%. We then discount this figure to today's value at a cost of equity of 6.1%. Relative to the current share price of €3.5, the company appears about fair value at a 9.7% discount to where the stock price trades currently. Remember though, that this is just an approximate valuation, and like any complex formula - garbage in, garbage out.
Value Per Share = Expected Dividend Per Share / (Discount Rate - Perpetual Growth Rate)
= €0.2 / (6.1% – 0.8%)
= €3.9
The Assumptions
The calculation above is very dependent on two assumptions. The first is the discount rate and the other is the cash flows. If you don't agree with these result, have a go at the calculation yourself and play with the assumptions. The DCF also does not consider the possible cyclicality of an industry, or a company's future capital requirements, so it does not give a full picture of a company's potential performance. Given that we are looking at Ctac as potential shareholders, the cost of equity is used as the discount rate, rather than the cost of capital (or weighted average cost of capital, WACC) which accounts for debt. In this calculation we've used 6.1%, which is based on a levered beta of 1.167. Beta is a measure of a stock's volatility, compared to the market as a whole. We get our beta from the industry average beta of globally comparable companies, with an imposed limit between 0.8 and 2.0, which is a reasonable range for a stable business.
SWOT Analysis for Ctac
Strength
- Debt is not viewed as a risk.
Weakness
- Earnings declined over the past year.
- Dividend is low compared to the top 25% of dividend payers in the IT market.
Opportunity
- Annual earnings are forecast to grow faster than the Dutch market.
- Current share price is below our estimate of fair value.
Threat
- Dividends are not covered by earnings.
Next Steps:
Although the valuation of a company is important, it shouldn't be the only metric you look at when researching a company. It's not possible to obtain a foolproof valuation with a DCF model. Rather it should be seen as a guide to "what assumptions need to be true for this stock to be under/overvalued?" If a company grows at a different rate, or if its cost of equity or risk free rate changes sharply, the output can look very different. For Ctac, we've compiled three essential elements you should look at:
- Risks: Case in point, we've spotted 4 warning signs for Ctac you should be aware of.
- Future Earnings: How does CTAC's growth rate compare to its peers and the wider market? Dig deeper into the analyst consensus number for the upcoming years by interacting with our free analyst growth expectation chart.
- Other High Quality Alternatives: Do you like a good all-rounder? Explore our interactive list of high quality stocks to get an idea of what else is out there you may be missing!
PS. The Simply Wall St app conducts a discounted cash flow valuation for every stock on the ENXTAM every day. If you want to find the calculation for other stocks just search here.
New: AI Stock Screener & Alerts
Our new AI Stock Screener scans the market every day to uncover opportunities.
• Dividend Powerhouses (3%+ Yield)
• Undervalued Small Caps with Insider Buying
• High growth Tech and AI Companies
Or build your own from over 50 metrics.
Have feedback on this article? Concerned about the content? Get in touch with us directly. Alternatively, email editorial-team (at) simplywallst.com.
This article by Simply Wall St is general in nature. We provide commentary based on historical data and analyst forecasts only using an unbiased methodology and our articles are not intended to be financial advice. It does not constitute a recommendation to buy or sell any stock, and does not take account of your objectives, or your financial situation. We aim to bring you long-term focused analysis driven by fundamental data. Note that our analysis may not factor in the latest price-sensitive company announcements or qualitative material. Simply Wall St has no position in any stocks mentioned.
About ENXTAM:CTAC
Ctac
Provides IT and business consulting services in the Netherlands and Belgium.
Flawless balance sheet, good value and pays a dividend.
Similar Companies
Market Insights

Advertisement
Community Narratives
MINISO's fair value is projected at 26.69 with an anticipated PE ratio shift of 20x
Fair Value US$24.03|11.0% undervalued
BE
Community Contributor
Procter & Gamble: A Dividend Giant Facing Slowing Growth
Fair Value US$119.81|23.3% overvalued
AN
Community Contributor
Eli Lilly's Future Growth Driven by Tirzepatide and Favorable Market Conditions
Fair Value US$1.19k|13.8% undervalued
EA
Community Contributor