

What underlying fundamental trends can indicate that a company might be in decline? More often than not, we'll see a declining return on capital employed (ROCE) and a declining amount of capital employed. This combination can tell you that not only is the company investing less, it's earning less on what it does invest. So after we looked into Beter Bed Holding (AMS:BBED), the trends above didn't look too great.
Understanding Return On Capital Employed (ROCE)
For those who don't know, ROCE is a measure of a company's yearly pre-tax profit (its return), relative to the capital employed in the business. The formula for this calculation on Beter Bed Holding is:
Return on Capital Employed = Earnings Before Interest and Tax (EBIT) ÷ (Total Assets - Current Liabilities)
0.08 = €2.4m ÷ (€99m - €68m) (Based on the trailing twelve months to June 2020).
So, Beter Bed Holding has an ROCE of 8.0%. In absolute terms, that's a low return but it's around the Specialty Retail industry average of 9.7%.
View our latest analysis for Beter Bed Holding
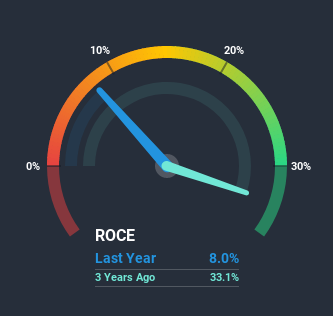
Above you can see how the current ROCE for Beter Bed Holding compares to its prior returns on capital, but there's only so much you can tell from the past. If you'd like, you can check out the forecasts from the analysts covering Beter Bed Holding here for free.
What Does the ROCE Trend For Beter Bed Holding Tell Us?
In terms of Beter Bed Holding's historical ROCE trend, it isn't fantastic. The company used to generate 37% on its capital five years ago but it has since fallen noticeably. In addition to that, Beter Bed Holding is now employing 59% less capital than it was five years ago. The combination of lower ROCE and less capital employed can indicate that a business is likely to be facing some competitive headwinds or seeing an erosion to its moat. Typically businesses that exhibit these characteristics aren't the ones that tend to multiply over the long term, because statistically speaking, they've already gone through the growth phase of their life cycle.
On a side note, Beter Bed Holding's current liabilities have increased over the last five years to 69% of total assets, effectively distorting the ROCE to some degree. If current liabilities hadn't increased as much as they did, the ROCE could actually be even lower. What this means is that in reality, a rather large portion of the business is being funded by the likes of the company's suppliers or short-term creditors, which can bring some risks of its own.What We Can Learn From Beter Bed Holding's ROCE
In short, lower returns and decreasing amounts capital employed in the business doesn't fill us with confidence. This could explain why the stock has sunk a total of 77% in the last five years. Unless there is a shift to a more positive trajectory in these metrics, we would look elsewhere.
On a final note, we found 3 warning signs for Beter Bed Holding (1 makes us a bit uncomfortable) you should be aware of.
While Beter Bed Holding isn't earning the highest return, check out this free list of companies that are earning high returns on equity with solid balance sheets.
When trading Beter Bed Holding or any other investment, use the platform considered by many to be the Professional's Gateway to the Worlds Market, Interactive Brokers. You get the lowest-cost* trading on stocks, options, futures, forex, bonds and funds worldwide from a single integrated account. Promoted
Valuation is complex, but we're here to simplify it.
Discover if Beter Bed Holding might be undervalued or overvalued with our detailed analysis, featuring fair value estimates, potential risks, dividends, insider trades, and its financial condition.
Access Free AnalysisThis article by Simply Wall St is general in nature. It does not constitute a recommendation to buy or sell any stock, and does not take account of your objectives, or your financial situation. We aim to bring you long-term focused analysis driven by fundamental data. Note that our analysis may not factor in the latest price-sensitive company announcements or qualitative material. Simply Wall St has no position in any stocks mentioned.
*Interactive Brokers Rated Lowest Cost Broker by StockBrokers.com Annual Online Review 2020
Have feedback on this article? Concerned about the content? Get in touch with us directly. Alternatively, email editorial-team@simplywallst.com.
About ENXTAM:BBED
Beter Bed Holding
Beter Bed Holding N.V. retails and wholesales bedroom furnishing products in the Netherlands and Belgium.
Flawless balance sheet with moderate growth potential.
Market Insights

Community Narratives

