- Netherlands
- /
- Biotech
- /
- ENXTAM:PHARM
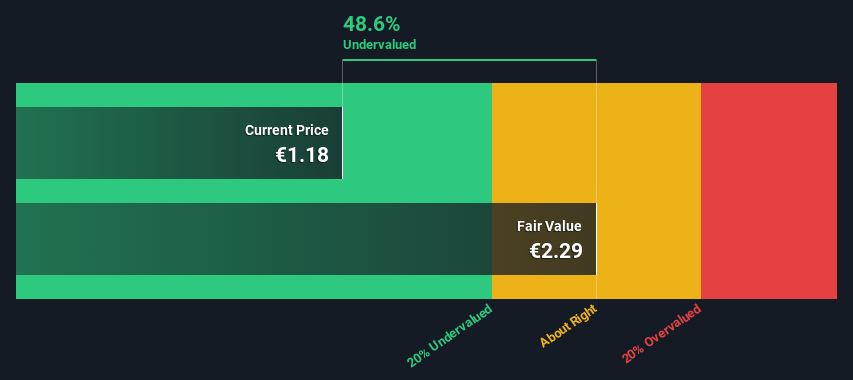
Pharming Group N.V. (AMS:PHARM) Shares Could Be 49% Below Their Intrinsic Value Estimate


Key Insights
- The projected fair value for Pharming Group is €2.29 based on 2 Stage Free Cash Flow to Equity
- Current share price of €1.18 suggests Pharming Group is potentially 49% undervalued
- The US$1.86 analyst price target for PHARM is 19% less than our estimate of fair value
In this article we are going to estimate the intrinsic value of Pharming Group N.V. (AMS:PHARM) by taking the expected future cash flows and discounting them to their present value. We will take advantage of the Discounted Cash Flow (DCF) model for this purpose. It may sound complicated, but actually it is quite simple!
We generally believe that a company's value is the present value of all of the cash it will generate in the future. However, a DCF is just one valuation metric among many, and it is not without flaws. Anyone interested in learning a bit more about intrinsic value should have a read of the Simply Wall St analysis model.
See our latest analysis for Pharming Group
The Calculation
We are going to use a two-stage DCF model, which, as the name states, takes into account two stages of growth. The first stage is generally a higher growth period which levels off heading towards the terminal value, captured in the second 'steady growth' period. In the first stage we need to estimate the cash flows to the business over the next ten years. Where possible we use analyst estimates, but when these aren't available we extrapolate the previous free cash flow (FCF) from the last estimate or reported value. We assume companies with shrinking free cash flow will slow their rate of shrinkage, and that companies with growing free cash flow will see their growth rate slow, over this period. We do this to reflect that growth tends to slow more in the early years than it does in later years.
Generally we assume that a dollar today is more valuable than a dollar in the future, so we discount the value of these future cash flows to their estimated value in today's dollars:
10-year free cash flow (FCF) forecast
| 2024 | 2025 | 2026 | 2027 | 2028 | 2029 | 2030 | 2031 | 2032 | 2033 | |
| Levered FCF ($, Millions) | US$30.5m | US$51.0m | US$57.5m | US$62.0m | US$65.6m | US$68.3m | US$70.4m | US$72.0m | US$73.3m | US$74.3m |
| Growth Rate Estimate Source | Analyst x4 | Analyst x4 | Analyst x1 | Est @ 7.91% | Est @ 5.70% | Est @ 4.15% | Est @ 3.06% | Est @ 2.30% | Est @ 1.77% | Est @ 1.40% |
| Present Value ($, Millions) Discounted @ 4.6% | US$29.2 | US$46.6 | US$50.2 | US$51.8 | US$52.3 | US$52.1 | US$51.3 | US$50.2 | US$48.8 | US$47.3 |
("Est" = FCF growth rate estimated by Simply Wall St)
Present Value of 10-year Cash Flow (PVCF) = US$480m
After calculating the present value of future cash flows in the initial 10-year period, we need to calculate the Terminal Value, which accounts for all future cash flows beyond the first stage. For a number of reasons a very conservative growth rate is used that cannot exceed that of a country's GDP growth. In this case we have used the 5-year average of the 10-year government bond yield (0.5%) to estimate future growth. In the same way as with the 10-year 'growth' period, we discount future cash flows to today's value, using a cost of equity of 4.6%.
Terminal Value (TV)= FCF2033 × (1 + g) ÷ (r – g) = US$74m× (1 + 0.5%) ÷ (4.6%– 0.5%) = US$1.8b
Present Value of Terminal Value (PVTV)= TV / (1 + r)10= US$1.8b÷ ( 1 + 4.6%)10= US$1.2b
The total value, or equity value, is then the sum of the present value of the future cash flows, which in this case is US$1.6b. The last step is to then divide the equity value by the number of shares outstanding. Relative to the current share price of €1.2, the company appears quite good value at a 49% discount to where the stock price trades currently. Remember though, that this is just an approximate valuation, and like any complex formula - garbage in, garbage out.
The Assumptions
The calculation above is very dependent on two assumptions. The first is the discount rate and the other is the cash flows. Part of investing is coming up with your own evaluation of a company's future performance, so try the calculation yourself and check your own assumptions. The DCF also does not consider the possible cyclicality of an industry, or a company's future capital requirements, so it does not give a full picture of a company's potential performance. Given that we are looking at Pharming Group as potential shareholders, the cost of equity is used as the discount rate, rather than the cost of capital (or weighted average cost of capital, WACC) which accounts for debt. In this calculation we've used 4.6%, which is based on a levered beta of 0.819. Beta is a measure of a stock's volatility, compared to the market as a whole. We get our beta from the industry average beta of globally comparable companies, with an imposed limit between 0.8 and 2.0, which is a reasonable range for a stable business.
SWOT Analysis for Pharming Group
- Debt is well covered by earnings.
- No major weaknesses identified for PHARM.
- Forecast to reduce losses next year.
- Has sufficient cash runway for more than 3 years based on current free cash flows.
- Good value based on P/S ratio and estimated fair value.
- Debt is not well covered by operating cash flow.
Looking Ahead:
Valuation is only one side of the coin in terms of building your investment thesis, and it shouldn't be the only metric you look at when researching a company. DCF models are not the be-all and end-all of investment valuation. Preferably you'd apply different cases and assumptions and see how they would impact the company's valuation. For example, changes in the company's cost of equity or the risk free rate can significantly impact the valuation. What is the reason for the share price sitting below the intrinsic value? For Pharming Group, there are three essential items you should further examine:
- Financial Health: Does PHARM have a healthy balance sheet? Take a look at our free balance sheet analysis with six simple checks on key factors like leverage and risk.
- Future Earnings: How does PHARM's growth rate compare to its peers and the wider market? Dig deeper into the analyst consensus number for the upcoming years by interacting with our free analyst growth expectation chart.
- Other Solid Businesses: Low debt, high returns on equity and good past performance are fundamental to a strong business. Why not explore our interactive list of stocks with solid business fundamentals to see if there are other companies you may not have considered!
PS. The Simply Wall St app conducts a discounted cash flow valuation for every stock on the ENXTAM every day. If you want to find the calculation for other stocks just search here.
New: Manage All Your Stock Portfolios in One Place
We've created the ultimate portfolio companion for stock investors, and it's free.
• Connect an unlimited number of Portfolios and see your total in one currency
• Be alerted to new Warning Signs or Risks via email or mobile
• Track the Fair Value of your stocks
Have feedback on this article? Concerned about the content? Get in touch with us directly. Alternatively, email editorial-team (at) simplywallst.com.
This article by Simply Wall St is general in nature. We provide commentary based on historical data and analyst forecasts only using an unbiased methodology and our articles are not intended to be financial advice. It does not constitute a recommendation to buy or sell any stock, and does not take account of your objectives, or your financial situation. We aim to bring you long-term focused analysis driven by fundamental data. Note that our analysis may not factor in the latest price-sensitive company announcements or qualitative material. Simply Wall St has no position in any stocks mentioned.
About ENXTAM:PHARM
Pharming Group
A biopharmaceutical company, develops and commercializes protein replacement therapies and precision medicines for the treatment of rare diseases in the United States, Europe, and internationally.
Undervalued with excellent balance sheet.
Similar Companies
Market Insights

Community Narratives

