- Netherlands
- /
- Chemicals
- /
- ENXTAM:OCI
While shareholders of OCI (AMS:OCI) are in the black over 3 years, those who bought a week ago aren't so fortunate


It might be of some concern to shareholders to see the OCI N.V. (AMS:OCI) share price down 12% in the last month. But over three years, the returns would have left most investors smiling To wit, the share price did better than an index fund, climbing 37% during that period.
While the stock has fallen 3.4% this week, it's worth focusing on the longer term and seeing if the stocks historical returns have been driven by the underlying fundamentals.
See our latest analysis for OCI
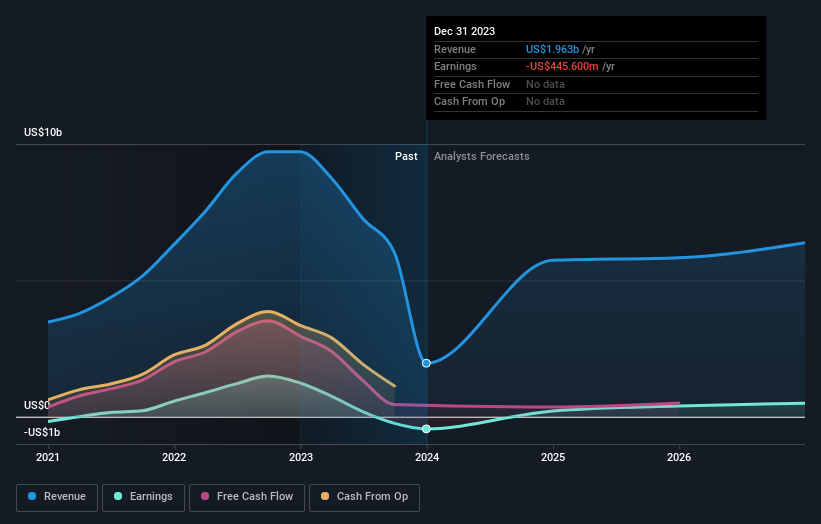
OCI wasn't profitable in the last twelve months, it is unlikely we'll see a strong correlation between its share price and its earnings per share (EPS). Arguably revenue is our next best option. Shareholders of unprofitable companies usually expect strong revenue growth. Some companies are willing to postpone profitability to grow revenue faster, but in that case one does expect good top-line growth.
Over the last three years OCI has grown its revenue at 12% annually. That's a very respectable growth rate. While the share price has done well, compounding at 11% yearly, over three years, that move doesn't seem over the top. Of course, valuation is quite sensitive to the rate of growth. Of course, it's always worth considering funding risks when a company isn't profitable.
The image below shows how earnings and revenue have tracked over time (if you click on the image you can see greater detail).
Take a more thorough look at OCI's financial health with this free report on its balance sheet.
What About Dividends?
It is important to consider the total shareholder return, as well as the share price return, for any given stock. The TSR incorporates the value of any spin-offs or discounted capital raisings, along with any dividends, based on the assumption that the dividends are reinvested. It's fair to say that the TSR gives a more complete picture for stocks that pay a dividend. We note that for OCI the TSR over the last 3 years was 83%, which is better than the share price return mentioned above. The dividends paid by the company have thusly boosted the total shareholder return.
A Different Perspective
OCI shareholders are down 9.6% for the year (even including dividends), but the market itself is up 17%. However, keep in mind that even the best stocks will sometimes underperform the market over a twelve month period. On the bright side, long term shareholders have made money, with a gain of 7% per year over half a decade. If the fundamental data continues to indicate long term sustainable growth, the current sell-off could be an opportunity worth considering. It's always interesting to track share price performance over the longer term. But to understand OCI better, we need to consider many other factors. For instance, we've identified 3 warning signs for OCI (1 is a bit unpleasant) that you should be aware of.
But note: OCI may not be the best stock to buy. So take a peek at this free list of interesting companies with past earnings growth (and further growth forecast).
Please note, the market returns quoted in this article reflect the market weighted average returns of stocks that currently trade on Dutch exchanges.
New: AI Stock Screener & Alerts
Our new AI Stock Screener scans the market every day to uncover opportunities.
• Dividend Powerhouses (3%+ Yield)
• Undervalued Small Caps with Insider Buying
• High growth Tech and AI Companies
Or build your own from over 50 metrics.
Have feedback on this article? Concerned about the content? Get in touch with us directly. Alternatively, email editorial-team (at) simplywallst.com.
This article by Simply Wall St is general in nature. We provide commentary based on historical data and analyst forecasts only using an unbiased methodology and our articles are not intended to be financial advice. It does not constitute a recommendation to buy or sell any stock, and does not take account of your objectives, or your financial situation. We aim to bring you long-term focused analysis driven by fundamental data. Note that our analysis may not factor in the latest price-sensitive company announcements or qualitative material. Simply Wall St has no position in any stocks mentioned.
About ENXTAM:OCI
OCI
Produces and distributes hydrogen-based and natural gas-based products to agricultural, transportation, and industrial customers.
Adequate balance sheet slight.

