
Advertisement
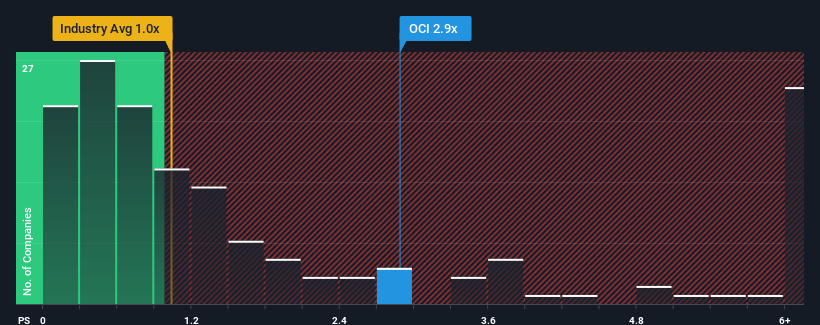
When close to half the companies in the Chemicals industry in the Netherlands have price-to-sales ratios (or "P/S") below 0.9x, you may consider OCI N.V. (AMS:OCI) as a stock to potentially avoid with its 2.9x P/S ratio. However, the P/S might be high for a reason and it requires further investigation to determine if it's justified.
View our latest analysis for OCI
What Does OCI's P/S Mean For Shareholders?
While the industry has experienced revenue growth lately, OCI's revenue has gone into reverse gear, which is not great. One possibility is that the P/S ratio is high because investors think this poor revenue performance will turn the corner. If not, then existing shareholders may be extremely nervous about the viability of the share price.
If you'd like to see what analysts are forecasting going forward, you should check out our free report on OCI.How Is OCI's Revenue Growth Trending?
OCI's P/S ratio would be typical for a company that's expected to deliver solid growth, and importantly, perform better than the industry.
In reviewing the last year of financials, we were disheartened to see the company's revenues fell to the tune of 47%. As a result, revenue from three years ago have also fallen 44% overall. So unfortunately, we have to acknowledge that the company has not done a great job of growing revenue over that time.
Looking ahead now, revenue is anticipated to climb by 43% per annum during the coming three years according to the five analysts following the company. That's shaping up to be materially lower than the 79% per year growth forecast for the broader industry.
With this in consideration, we believe it doesn't make sense that OCI's P/S is outpacing its industry peers. It seems most investors are hoping for a turnaround in the company's business prospects, but the analyst cohort is not so confident this will happen. There's a good chance these shareholders are setting themselves up for future disappointment if the P/S falls to levels more in line with the growth outlook.
The Bottom Line On OCI's P/S
While the price-to-sales ratio shouldn't be the defining factor in whether you buy a stock or not, it's quite a capable barometer of revenue expectations.
Despite analysts forecasting some poorer-than-industry revenue growth figures for OCI, this doesn't appear to be impacting the P/S in the slightest. Right now we aren't comfortable with the high P/S as the predicted future revenues aren't likely to support such positive sentiment for long. At these price levels, investors should remain cautious, particularly if things don't improve.
It's always necessary to consider the ever-present spectre of investment risk. We've identified 2 warning signs with OCI (at least 1 which is significant), and understanding these should be part of your investment process.
Of course, profitable companies with a history of great earnings growth are generally safer bets. So you may wish to see this free collection of other companies that have reasonable P/E ratios and have grown earnings strongly.
New: AI Stock Screener & Alerts
Our new AI Stock Screener scans the market every day to uncover opportunities.
• Dividend Powerhouses (3%+ Yield)
• Undervalued Small Caps with Insider Buying
• High growth Tech and AI Companies
Or build your own from over 50 metrics.
Have feedback on this article? Concerned about the content? Get in touch with us directly. Alternatively, email editorial-team (at) simplywallst.com.
This article by Simply Wall St is general in nature. We provide commentary based on historical data and analyst forecasts only using an unbiased methodology and our articles are not intended to be financial advice. It does not constitute a recommendation to buy or sell any stock, and does not take account of your objectives, or your financial situation. We aim to bring you long-term focused analysis driven by fundamental data. Note that our analysis may not factor in the latest price-sensitive company announcements or qualitative material. Simply Wall St has no position in any stocks mentioned.
About ENXTAM:OCI
OCI
Produces and distributes hydrogen-based and natural gas-based products to agricultural, transportation, and industrial customers in Europe, the Americas, the Middle East, Africa, Asia, and Oceania.
Excellent balance sheet and fair value.
Market Insights

Advertisement
Community Narratives
Kodiak AI - a potential 100 bagger opportunity?
Fair Value US$14.00|44.7% undervalued
DA
Community Contributor
A Fair Price for a Great Business Facing Real Threats
Fair Value US$383.06|13.0% undervalued
IM
Community Contributor
AXON And Shopify Integration Will Unlock Global Mobile Advertising
Fair Value US$646.30|0% overvalued
AN
Based on Analyst Price Targets