
Cabka (AMS:CABKA) Full Year 2022 Results
Key Financial Results
- Revenue: €222.6m (up 28% from FY 2021).
- Net loss: €34.0m (down from €4.94m profit in FY 2021).
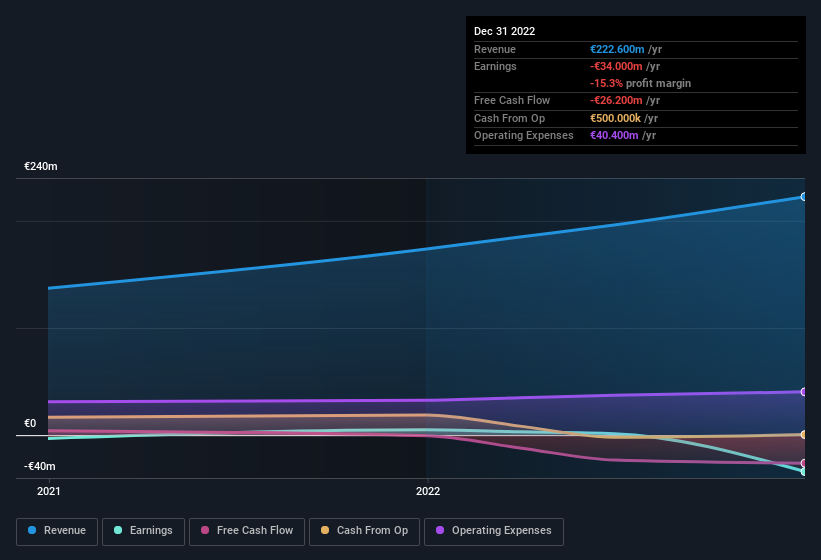
All figures shown in the chart above are for the trailing 12 month (TTM) period
Cabka Earnings Insights
Looking ahead, revenue is forecast to grow 4.5% p.a. on average during the next 3 years, compared to a 3.8% growth forecast for the Packaging industry in Europe.
Performance of the market in the Netherlands.
The company's shares are up 7.6% from a week ago.
Balance Sheet Analysis
While it's very important to consider the profit and loss statement, you can also learn a lot about a company by looking at its balance sheet. See our latest analysis on Cabka's balance sheet health.
If you're looking to trade Cabka, open an account with the lowest-cost platform trusted by professionals, Interactive Brokers.
With clients in over 200 countries and territories, and access to 160 markets, IBKR lets you trade stocks, options, futures, forex, bonds and funds from a single integrated account.
Enjoy no hidden fees, no account minimums, and FX conversion rates as low as 0.03%, far better than what most brokers offer.
Sponsored ContentNew: AI Stock Screener & Alerts
Our new AI Stock Screener scans the market every day to uncover opportunities.
• Dividend Powerhouses (3%+ Yield)
• Undervalued Small Caps with Insider Buying
• High growth Tech and AI Companies
Or build your own from over 50 metrics.
Have feedback on this article? Concerned about the content? Get in touch with us directly. Alternatively, email editorial-team (at) simplywallst.com.
This article by Simply Wall St is general in nature. We provide commentary based on historical data and analyst forecasts only using an unbiased methodology and our articles are not intended to be financial advice. It does not constitute a recommendation to buy or sell any stock, and does not take account of your objectives, or your financial situation. We aim to bring you long-term focused analysis driven by fundamental data. Note that our analysis may not factor in the latest price-sensitive company announcements or qualitative material. Simply Wall St has no position in any stocks mentioned.
About ENXTAM:CABKA
Cabka
Manufactures and sells pallets and large containers made from recycled plastic in Europe, North America, and internationally.
Undervalued with moderate growth potential.
Market Insights

Community Narratives

