
Advertisement
- Netherlands
- /
- Packaging
- /
- ENXTAM:CABKA
A Piece Of The Puzzle Missing From Cabka N.V.'s (AMS:CABKA) 26% Share Price Climb
Those holding Cabka N.V. (AMS:CABKA) shares would be relieved that the share price has rebounded 26% in the last thirty days, but it needs to keep going to repair the recent damage it has caused to investor portfolios. Not all shareholders will be feeling jubilant, since the share price is still down a very disappointing 18% in the last twelve months.
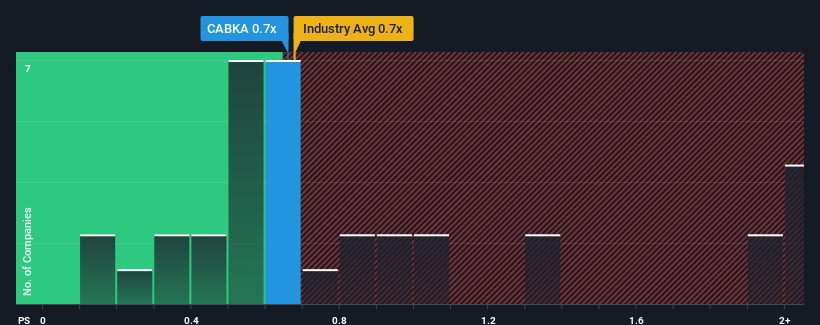
Although its price has surged higher, it's still not a stretch to say that Cabka's price-to-sales (or "P/S") ratio of 0.7x right now seems quite "middle-of-the-road" compared to the Packaging industry in the Netherlands, seeing as it matches the P/S ratio of the wider industry. Although, it's not wise to simply ignore the P/S without explanation as investors may be disregarding a distinct opportunity or a costly mistake.
Check out our latest analysis for Cabka
How Has Cabka Performed Recently?
Recent times haven't been great for Cabka as its revenue has been falling quicker than most other companies. Perhaps the market is expecting future revenue performance to begin matching the rest of the industry, which has kept the P/S from declining. If you still like the company, you'd want its revenue trajectory to turn around before making any decisions. If not, then existing shareholders may be a little nervous about the viability of the share price.
Want the full picture on analyst estimates for the company? Then our free report on Cabka will help you uncover what's on the horizon.Do Revenue Forecasts Match The P/S Ratio?
The only time you'd be comfortable seeing a P/S like Cabka's is when the company's growth is tracking the industry closely.
Taking a look back first, the company's revenue growth last year wasn't something to get excited about as it posted a disappointing decline of 3.6%. Still, the latest three year period has seen an excellent 50% overall rise in revenue, in spite of its unsatisfying short-term performance. Accordingly, while they would have preferred to keep the run going, shareholders would definitely welcome the medium-term rates of revenue growth.
Turning to the outlook, the next three years should generate growth of 7.2% each year as estimated by the three analysts watching the company. That's shaping up to be materially higher than the 2.9% each year growth forecast for the broader industry.
With this information, we find it interesting that Cabka is trading at a fairly similar P/S compared to the industry. Apparently some shareholders are skeptical of the forecasts and have been accepting lower selling prices.
What We Can Learn From Cabka's P/S?
Its shares have lifted substantially and now Cabka's P/S is back within range of the industry median. Generally, our preference is to limit the use of the price-to-sales ratio to establishing what the market thinks about the overall health of a company.
We've established that Cabka currently trades on a lower than expected P/S since its forecasted revenue growth is higher than the wider industry. Perhaps uncertainty in the revenue forecasts are what's keeping the P/S ratio consistent with the rest of the industry. However, if you agree with the analysts' forecasts, you may be able to pick up the stock at an attractive price.
It's always necessary to consider the ever-present spectre of investment risk. We've identified 3 warning signs with Cabka (at least 2 which can't be ignored), and understanding them should be part of your investment process.
If you're unsure about the strength of Cabka's business, why not explore our interactive list of stocks with solid business fundamentals for some other companies you may have missed.
New: AI Stock Screener & Alerts
Our new AI Stock Screener scans the market every day to uncover opportunities.
• Dividend Powerhouses (3%+ Yield)
• Undervalued Small Caps with Insider Buying
• High growth Tech and AI Companies
Or build your own from over 50 metrics.
Have feedback on this article? Concerned about the content? Get in touch with us directly. Alternatively, email editorial-team (at) simplywallst.com.
This article by Simply Wall St is general in nature. We provide commentary based on historical data and analyst forecasts only using an unbiased methodology and our articles are not intended to be financial advice. It does not constitute a recommendation to buy or sell any stock, and does not take account of your objectives, or your financial situation. We aim to bring you long-term focused analysis driven by fundamental data. Note that our analysis may not factor in the latest price-sensitive company announcements or qualitative material. Simply Wall St has no position in any stocks mentioned.
About ENXTAM:CABKA
Cabka
Manufactures and sells pallets and large containers made from recycled plastic in Europe, North America, and internationally.
Very undervalued with moderate growth potential.
Market Insights

Advertisement
Community Narratives
100% Patient Improvement in trial puts this $16M Biotech on the radar
Fair Value US$5.30|65.7% undervalued
JO
Community Contributor
Exxon Mobil's 17.5% Upside Promises Industry-Leading Returns in Energy Transition
Fair Value US$132.00|14.9% undervalued
HE
Community Contributor
NHC Analysis: Quality at a Good Price. A Golden Opportunity?
Fair Value US$179.80|35.4% undervalued
DA
Community Contributor
Product Refresh And Global Expansion Will Empower Future Market Leadership
Fair Value US$202.60|21.0% undervalued
AN
Based on Analyst Price Targets