
Advertisement
Key Insights
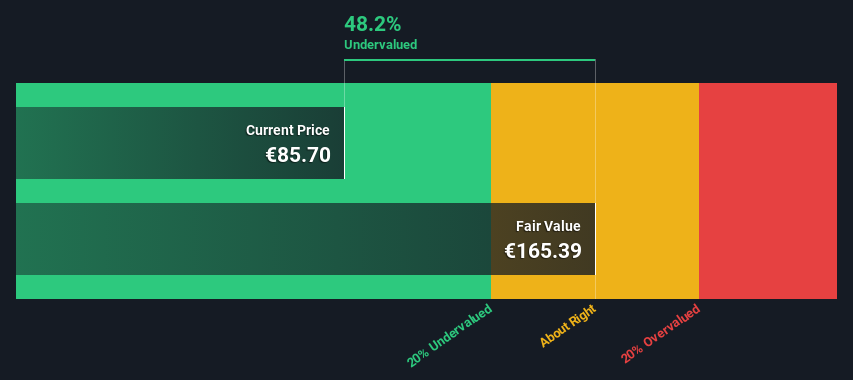
- Heineken's estimated fair value is €165 based on 2 Stage Free Cash Flow to Equity
- Current share price of €85.70 suggests Heineken is potentially 48% undervalued
- The €101 analyst price target for HEIA is 39% less than our estimate of fair value
Does the December share price for Heineken N.V. (AMS:HEIA) reflect what it's really worth? Today, we will estimate the stock's intrinsic value by taking the expected future cash flows and discounting them to today's value. One way to achieve this is by employing the Discounted Cash Flow (DCF) model. Models like these may appear beyond the comprehension of a lay person, but they're fairly easy to follow.
Companies can be valued in a lot of ways, so we would point out that a DCF is not perfect for every situation. If you want to learn more about discounted cash flow, the rationale behind this calculation can be read in detail in the Simply Wall St analysis model.
View our latest analysis for Heineken
The Model
We are going to use a two-stage DCF model, which, as the name states, takes into account two stages of growth. The first stage is generally a higher growth period which levels off heading towards the terminal value, captured in the second 'steady growth' period. To begin with, we have to get estimates of the next ten years of cash flows. Where possible we use analyst estimates, but when these aren't available we extrapolate the previous free cash flow (FCF) from the last estimate or reported value. We assume companies with shrinking free cash flow will slow their rate of shrinkage, and that companies with growing free cash flow will see their growth rate slow, over this period. We do this to reflect that growth tends to slow more in the early years than it does in later years.
A DCF is all about the idea that a dollar in the future is less valuable than a dollar today, and so the sum of these future cash flows is then discounted to today's value:
10-year free cash flow (FCF) estimate
| 2024 | 2025 | 2026 | 2027 | 2028 | 2029 | 2030 | 2031 | 2032 | 2033 | |
| Levered FCF (€, Millions) | €2.94b | €3.47b | €3.75b | €3.91b | €4.03b | €4.12b | €4.19b | €4.25b | €4.30b | €4.35b |
| Growth Rate Estimate Source | Analyst x9 | Analyst x9 | Analyst x1 | Analyst x1 | Est @ 2.97% | Est @ 2.28% | Est @ 1.79% | Est @ 1.45% | Est @ 1.21% | Est @ 1.04% |
| Present Value (€, Millions) Discounted @ 4.9% | €2.8k | €3.1k | €3.2k | €3.2k | €3.2k | €3.1k | €3.0k | €2.9k | €2.8k | €2.7k |
("Est" = FCF growth rate estimated by Simply Wall St)
Present Value of 10-year Cash Flow (PVCF) = €30b
After calculating the present value of future cash flows in the initial 10-year period, we need to calculate the Terminal Value, which accounts for all future cash flows beyond the first stage. For a number of reasons a very conservative growth rate is used that cannot exceed that of a country's GDP growth. In this case we have used the 5-year average of the 10-year government bond yield (0.6%) to estimate future growth. In the same way as with the 10-year 'growth' period, we discount future cash flows to today's value, using a cost of equity of 4.9%.
Terminal Value (TV)= FCF2033 × (1 + g) ÷ (r – g) = €4.3b× (1 + 0.6%) ÷ (4.9%– 0.6%) = €103b
Present Value of Terminal Value (PVTV)= TV / (1 + r)10= €103b÷ ( 1 + 4.9%)10= €64b
The total value is the sum of cash flows for the next ten years plus the discounted terminal value, which results in the Total Equity Value, which in this case is €94b. The last step is to then divide the equity value by the number of shares outstanding. Compared to the current share price of €85.7, the company appears quite undervalued at a 48% discount to where the stock price trades currently. The assumptions in any calculation have a big impact on the valuation, so it is better to view this as a rough estimate, not precise down to the last cent.
Important Assumptions
We would point out that the most important inputs to a discounted cash flow are the discount rate and of course the actual cash flows. You don't have to agree with these inputs, I recommend redoing the calculations yourself and playing with them. The DCF also does not consider the possible cyclicality of an industry, or a company's future capital requirements, so it does not give a full picture of a company's potential performance. Given that we are looking at Heineken as potential shareholders, the cost of equity is used as the discount rate, rather than the cost of capital (or weighted average cost of capital, WACC) which accounts for debt. In this calculation we've used 4.9%, which is based on a levered beta of 0.852. Beta is a measure of a stock's volatility, compared to the market as a whole. We get our beta from the industry average beta of globally comparable companies, with an imposed limit between 0.8 and 2.0, which is a reasonable range for a stable business.
SWOT Analysis for Heineken
Strength
- Debt is well covered by earnings.
Weakness
- Earnings declined over the past year.
- Dividend is low compared to the top 25% of dividend payers in the Beverage market.
Opportunity
- Annual earnings are forecast to grow faster than the Dutch market.
- Good value based on P/E ratio and estimated fair value.
Threat
- Debt is not well covered by operating cash flow.
- Dividends are not covered by cash flow.
- Revenue is forecast to grow slower than 20% per year.
Next Steps:
Although the valuation of a company is important, it ideally won't be the sole piece of analysis you scrutinize for a company. It's not possible to obtain a foolproof valuation with a DCF model. Instead the best use for a DCF model is to test certain assumptions and theories to see if they would lead to the company being undervalued or overvalued. If a company grows at a different rate, or if its cost of equity or risk free rate changes sharply, the output can look very different. Can we work out why the company is trading at a discount to intrinsic value? For Heineken, we've put together three fundamental items you should consider:
- Risks: We feel that you should assess the 2 warning signs for Heineken (1 doesn't sit too well with us!) we've flagged before making an investment in the company.
- Future Earnings: How does HEIA's growth rate compare to its peers and the wider market? Dig deeper into the analyst consensus number for the upcoming years by interacting with our free analyst growth expectation chart.
- Other Solid Businesses: Low debt, high returns on equity and good past performance are fundamental to a strong business. Why not explore our interactive list of stocks with solid business fundamentals to see if there are other companies you may not have considered!
PS. The Simply Wall St app conducts a discounted cash flow valuation for every stock on the ENXTAM every day. If you want to find the calculation for other stocks just search here.
Valuation is complex, but we're here to simplify it.
Discover if Heineken might be undervalued or overvalued with our detailed analysis, featuring fair value estimates, potential risks, dividends, insider trades, and its financial condition.
Access Free AnalysisHave feedback on this article? Concerned about the content? Get in touch with us directly. Alternatively, email editorial-team (at) simplywallst.com.
This article by Simply Wall St is general in nature. We provide commentary based on historical data and analyst forecasts only using an unbiased methodology and our articles are not intended to be financial advice. It does not constitute a recommendation to buy or sell any stock, and does not take account of your objectives, or your financial situation. We aim to bring you long-term focused analysis driven by fundamental data. Note that our analysis may not factor in the latest price-sensitive company announcements or qualitative material. Simply Wall St has no position in any stocks mentioned.
About ENXTAM:HEIA
Heineken
Heineken N.V. brews and sells beer and cider in the Americas, Europe, Africa, the Middle East, and the Asia Pacific.
Fair value with moderate growth potential.
Market Insights


Advertisement
Community Narratives
Rocket Lab USA Will Ignite a 30% Revenue Growth Journey
Fair Value US$31.72|41.3% undervalued
KI
Community Contributor
EasyJet weirdly unloved by investors in spite of relatively attractive metrics
Fair Value UK£6.95|33.9% undervalued
PI
Community Contributor
HEXPOL AB: Sustained Long Term Growth, Stable Margins, and Strategic M&A
Fair Value SEK 122.27|27.0% undervalued
MA
Community Contributor