- Netherlands
- /
- Beverage
- /
- ENXTAM:CCEP
Investors in Coca-Cola Europacific Partners (AMS:CCEP) have seen respectable returns of 79% over the past three years


By buying an index fund, you can roughly match the market return with ease. But if you choose individual stocks with prowess, you can make superior returns. For example, the Coca-Cola Europacific Partners PLC (AMS:CCEP) share price is up 60% in the last three years, clearly besting the market decline of around 5.2% (not including dividends). On the other hand, the returns haven't been quite so good recently, with shareholders up just 38%, including dividends.
So let's investigate and see if the longer term performance of the company has been in line with the underlying business' progress.
View our latest analysis for Coca-Cola Europacific Partners
To paraphrase Benjamin Graham: Over the short term the market is a voting machine, but over the long term it's a weighing machine. By comparing earnings per share (EPS) and share price changes over time, we can get a feel for how investor attitudes to a company have morphed over time.
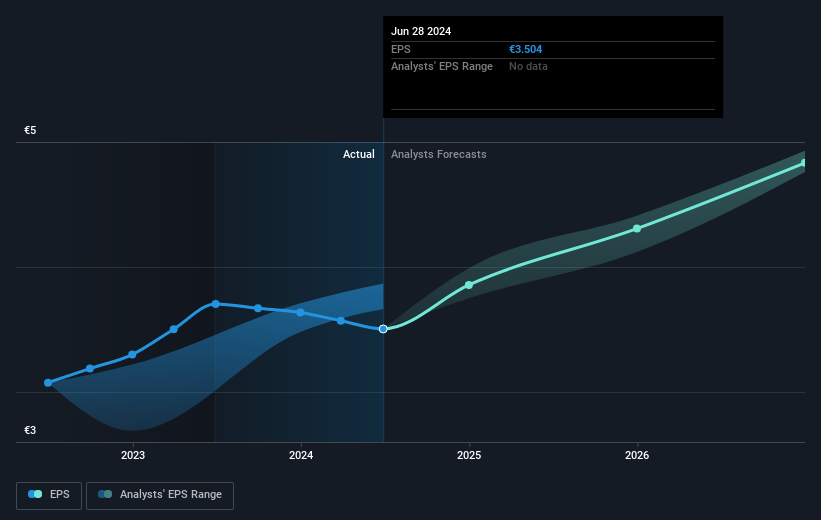
Coca-Cola Europacific Partners was able to grow its EPS at 37% per year over three years, sending the share price higher. The average annual share price increase of 17% is actually lower than the EPS growth. So one could reasonably conclude that the market has cooled on the stock.
The company's earnings per share (over time) is depicted in the image below (click to see the exact numbers).
It is of course excellent to see how Coca-Cola Europacific Partners has grown profits over the years, but the future is more important for shareholders. This free interactive report on Coca-Cola Europacific Partners' balance sheet strength is a great place to start, if you want to investigate the stock further.
What About Dividends?
When looking at investment returns, it is important to consider the difference between total shareholder return (TSR) and share price return. Whereas the share price return only reflects the change in the share price, the TSR includes the value of dividends (assuming they were reinvested) and the benefit of any discounted capital raising or spin-off. Arguably, the TSR gives a more comprehensive picture of the return generated by a stock. We note that for Coca-Cola Europacific Partners the TSR over the last 3 years was 79%, which is better than the share price return mentioned above. And there's no prize for guessing that the dividend payments largely explain the divergence!
A Different Perspective
It's nice to see that Coca-Cola Europacific Partners shareholders have received a total shareholder return of 38% over the last year. Of course, that includes the dividend. That gain is better than the annual TSR over five years, which is 12%. Therefore it seems like sentiment around the company has been positive lately. Someone with an optimistic perspective could view the recent improvement in TSR as indicating that the business itself is getting better with time. I find it very interesting to look at share price over the long term as a proxy for business performance. But to truly gain insight, we need to consider other information, too. Consider for instance, the ever-present spectre of investment risk. We've identified 3 warning signs with Coca-Cola Europacific Partners , and understanding them should be part of your investment process.
Of course Coca-Cola Europacific Partners may not be the best stock to buy. So you may wish to see this free collection of growth stocks.
Please note, the market returns quoted in this article reflect the market weighted average returns of stocks that currently trade on Dutch exchanges.
New: AI Stock Screener & Alerts
Our new AI Stock Screener scans the market every day to uncover opportunities.
• Dividend Powerhouses (3%+ Yield)
• Undervalued Small Caps with Insider Buying
• High growth Tech and AI Companies
Or build your own from over 50 metrics.
Have feedback on this article? Concerned about the content? Get in touch with us directly. Alternatively, email editorial-team (at) simplywallst.com.
This article by Simply Wall St is general in nature. We provide commentary based on historical data and analyst forecasts only using an unbiased methodology and our articles are not intended to be financial advice. It does not constitute a recommendation to buy or sell any stock, and does not take account of your objectives, or your financial situation. We aim to bring you long-term focused analysis driven by fundamental data. Note that our analysis may not factor in the latest price-sensitive company announcements or qualitative material. Simply Wall St has no position in any stocks mentioned.
About ENXTAM:CCEP
Coca-Cola Europacific Partners
Produces, distributes, and sells a range of non-alcoholic ready to drink beverages.
Good value second-rate dividend payer.

