- Netherlands
- /
- Beverage
- /
- ENXTAM:CCEP
Coca-Cola Europacific Partners PLC's (AMS:CCEP) Intrinsic Value Is Potentially 54% Above Its Share Price


Today we will run through one way of estimating the intrinsic value of Coca-Cola Europacific Partners PLC (AMS:CCEP) by taking the forecast future cash flows of the company and discounting them back to today's value. Our analysis will employ the Discounted Cash Flow (DCF) model. Don't get put off by the jargon, the math behind it is actually quite straightforward.
We generally believe that a company's value is the present value of all of the cash it will generate in the future. However, a DCF is just one valuation metric among many, and it is not without flaws. If you still have some burning questions about this type of valuation, take a look at the Simply Wall St analysis model.
See our latest analysis for Coca-Cola Europacific Partners
The Method
We use what is known as a 2-stage model, which simply means we have two different periods of growth rates for the company's cash flows. Generally the first stage is higher growth, and the second stage is a lower growth phase. In the first stage we need to estimate the cash flows to the business over the next ten years. Where possible we use analyst estimates, but when these aren't available we extrapolate the previous free cash flow (FCF) from the last estimate or reported value. We assume companies with shrinking free cash flow will slow their rate of shrinkage, and that companies with growing free cash flow will see their growth rate slow, over this period. We do this to reflect that growth tends to slow more in the early years than it does in later years.
Generally we assume that a dollar today is more valuable than a dollar in the future, and so the sum of these future cash flows is then discounted to today's value:
10-year free cash flow (FCF) forecast
| 2023 | 2024 | 2025 | 2026 | 2027 | 2028 | 2029 | 2030 | 2031 | 2032 | |
| Levered FCF (€, Millions) | €1.73b | €1.84b | €1.74b | €1.68b | €1.64b | €1.61b | €1.59b | €1.58b | €1.57b | €1.56b |
| Growth Rate Estimate Source | Analyst x7 | Analyst x7 | Est @ -5.3% | Est @ -3.67% | Est @ -2.53% | Est @ -1.73% | Est @ -1.17% | Est @ -0.78% | Est @ -0.51% | Est @ -0.32% |
| Present Value (€, Millions) Discounted @ 4.4% | €1.7k | €1.7k | €1.5k | €1.4k | €1.3k | €1.2k | €1.2k | €1.1k | €1.1k | €1.0k |
("Est" = FCF growth rate estimated by Simply Wall St)
Present Value of 10-year Cash Flow (PVCF) = €13b
The second stage is also known as Terminal Value, this is the business's cash flow after the first stage. The Gordon Growth formula is used to calculate Terminal Value at a future annual growth rate equal to the 5-year average of the 10-year government bond yield of 0.1%. We discount the terminal cash flows to today's value at a cost of equity of 4.4%.
Terminal Value (TV)= FCF2032 × (1 + g) ÷ (r – g) = €1.6b× (1 + 0.1%) ÷ (4.4%– 0.1%) = €37b
Present Value of Terminal Value (PVTV)= TV / (1 + r)10= €37b÷ ( 1 + 4.4%)10= €24b
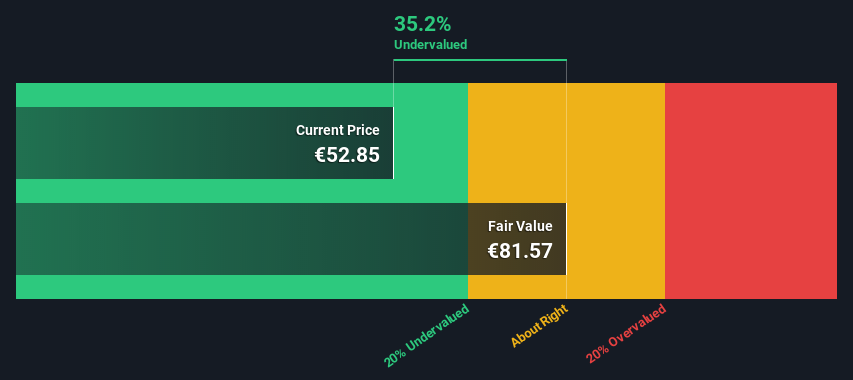
The total value is the sum of cash flows for the next ten years plus the discounted terminal value, which results in the Total Equity Value, which in this case is €37b. In the final step we divide the equity value by the number of shares outstanding. Compared to the current share price of €52.9, the company appears quite good value at a 35% discount to where the stock price trades currently. The assumptions in any calculation have a big impact on the valuation, so it is better to view this as a rough estimate, not precise down to the last cent.
Important Assumptions
We would point out that the most important inputs to a discounted cash flow are the discount rate and of course the actual cash flows. If you don't agree with these result, have a go at the calculation yourself and play with the assumptions. The DCF also does not consider the possible cyclicality of an industry, or a company's future capital requirements, so it does not give a full picture of a company's potential performance. Given that we are looking at Coca-Cola Europacific Partners as potential shareholders, the cost of equity is used as the discount rate, rather than the cost of capital (or weighted average cost of capital, WACC) which accounts for debt. In this calculation we've used 4.4%, which is based on a levered beta of 0.878. Beta is a measure of a stock's volatility, compared to the market as a whole. We get our beta from the industry average beta of globally comparable companies, with an imposed limit between 0.8 and 2.0, which is a reasonable range for a stable business.
Moving On:
Valuation is only one side of the coin in terms of building your investment thesis, and it is only one of many factors that you need to assess for a company. DCF models are not the be-all and end-all of investment valuation. Instead the best use for a DCF model is to test certain assumptions and theories to see if they would lead to the company being undervalued or overvalued. For example, changes in the company's cost of equity or the risk free rate can significantly impact the valuation. What is the reason for the share price sitting below the intrinsic value? For Coca-Cola Europacific Partners, there are three relevant elements you should assess:
- Risks: For example, we've discovered 1 warning sign for Coca-Cola Europacific Partners that you should be aware of before investing here.
- Future Earnings: How does CCEP's growth rate compare to its peers and the wider market? Dig deeper into the analyst consensus number for the upcoming years by interacting with our free analyst growth expectation chart.
- Other High Quality Alternatives: Do you like a good all-rounder? Explore our interactive list of high quality stocks to get an idea of what else is out there you may be missing!
PS. Simply Wall St updates its DCF calculation for every Dutch stock every day, so if you want to find the intrinsic value of any other stock just search here.
New: AI Stock Screener & Alerts
Our new AI Stock Screener scans the market every day to uncover opportunities.
• Dividend Powerhouses (3%+ Yield)
• Undervalued Small Caps with Insider Buying
• High growth Tech and AI Companies
Or build your own from over 50 metrics.
Have feedback on this article? Concerned about the content? Get in touch with us directly. Alternatively, email editorial-team (at) simplywallst.com.
This article by Simply Wall St is general in nature. We provide commentary based on historical data and analyst forecasts only using an unbiased methodology and our articles are not intended to be financial advice. It does not constitute a recommendation to buy or sell any stock, and does not take account of your objectives, or your financial situation. We aim to bring you long-term focused analysis driven by fundamental data. Note that our analysis may not factor in the latest price-sensitive company announcements or qualitative material. Simply Wall St has no position in any stocks mentioned.
About ENXTAM:CCEP
Coca-Cola Europacific Partners
Produces, distributes, and sells a range of non-alcoholic ready to drink beverages.
Slightly overvalued with limited growth.
Similar Companies
Market Insights

Community Narratives

