- Netherlands
- /
- Energy Services
- /
- ENXTAM:SBMO
SBM Offshore (AMS:SBMO) shareholders YoY returns are lagging the company's 4.0% five-year earnings growth


For many, the main point of investing is to generate higher returns than the overall market. But in any portfolio, there will be mixed results between individual stocks. At this point some shareholders may be questioning their investment in SBM Offshore N.V. (AMS:SBMO), since the last five years saw the share price fall 11%. And the share price decline continued over the last week, dropping some 5.5%. But this could be related to the soft market, which is down about 5.0% in the same period.
If the past week is anything to go by, investor sentiment for SBM Offshore isn't positive, so let's see if there's a mismatch between fundamentals and the share price.
See our latest analysis for SBM Offshore
In his essay The Superinvestors of Graham-and-Doddsville Warren Buffett described how share prices do not always rationally reflect the value of a business. By comparing earnings per share (EPS) and share price changes over time, we can get a feel for how investor attitudes to a company have morphed over time.
During the unfortunate half decade during which the share price slipped, SBM Offshore actually saw its earnings per share (EPS) improve by 22% per year. So it doesn't seem like EPS is a great guide to understanding how the market is valuing the stock. Alternatively, growth expectations may have been unreasonable in the past.
It is unusual to see such modest share price growth in the face of sustained EPS improvements. We can look to other metrics to try to understand the situation better.
The steady dividend doesn't really explain why the share price is down. While it's not completely obvious why the share price is down, a closer look at the company's history might help explain it.
You can see below how earnings and revenue have changed over time (discover the exact values by clicking on the image).
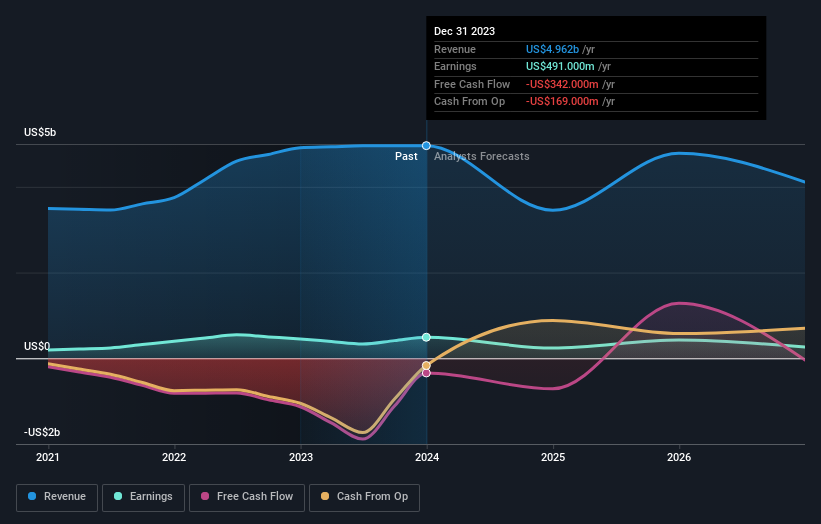
It is of course excellent to see how SBM Offshore has grown profits over the years, but the future is more important for shareholders. Take a more thorough look at SBM Offshore's financial health with this free report on its balance sheet.
What About Dividends?
As well as measuring the share price return, investors should also consider the total shareholder return (TSR). The TSR is a return calculation that accounts for the value of cash dividends (assuming that any dividend received was reinvested) and the calculated value of any discounted capital raisings and spin-offs. So for companies that pay a generous dividend, the TSR is often a lot higher than the share price return. We note that for SBM Offshore the TSR over the last 5 years was 20%, which is better than the share price return mentioned above. And there's no prize for guessing that the dividend payments largely explain the divergence!
A Different Perspective
SBM Offshore shareholders are up 4.7% for the year (even including dividends). Unfortunately this falls short of the market return. On the bright side, that's still a gain, and it's actually better than the average return of 4% over half a decade This suggests the company might be improving over time. While it is well worth considering the different impacts that market conditions can have on the share price, there are other factors that are even more important. Like risks, for instance. Every company has them, and we've spotted 3 warning signs for SBM Offshore (of which 2 are a bit concerning!) you should know about.
For those who like to find winning investments this free list of undervalued companies with recent insider purchasing, could be just the ticket.
Please note, the market returns quoted in this article reflect the market weighted average returns of stocks that currently trade on Dutch exchanges.
New: Manage All Your Stock Portfolios in One Place
We've created the ultimate portfolio companion for stock investors, and it's free.
• Connect an unlimited number of Portfolios and see your total in one currency
• Be alerted to new Warning Signs or Risks via email or mobile
• Track the Fair Value of your stocks
Have feedback on this article? Concerned about the content? Get in touch with us directly. Alternatively, email editorial-team (at) simplywallst.com.
This article by Simply Wall St is general in nature. We provide commentary based on historical data and analyst forecasts only using an unbiased methodology and our articles are not intended to be financial advice. It does not constitute a recommendation to buy or sell any stock, and does not take account of your objectives, or your financial situation. We aim to bring you long-term focused analysis driven by fundamental data. Note that our analysis may not factor in the latest price-sensitive company announcements or qualitative material. Simply Wall St has no position in any stocks mentioned.
Have feedback on this article? Concerned about the content? Get in touch with us directly. Alternatively, email editorial-team@simplywallst.com
About ENXTAM:SBMO
SBM Offshore
Provides floating production solutions to the offshore energy industry worldwide.
Undervalued with solid track record.

