- Netherlands
- /
- Leisure
- /
- ENXTAM:ACCEL
If You Had Bought Accell Group (AMS:ACCEL) Stock Five Years Ago, You Could Pocket A 35% Gain Today


Stock pickers are generally looking for stocks that will outperform the broader market. And while active stock picking involves risks (and requires diversification) it can also provide excess returns. For example, the Accell Group N.V. (AMS:ACCEL) share price is up 35% in the last 5 years, clearly besting the market return of around 24% (ignoring dividends). On the other hand, the more recent gains haven't been so impressive, with shareholders gaining just 2.7%.
See our latest analysis for Accell Group
To paraphrase Benjamin Graham: Over the short term the market is a voting machine, but over the long term it's a weighing machine. One imperfect but simple way to consider how the market perception of a company has shifted is to compare the change in the earnings per share (EPS) with the share price movement.
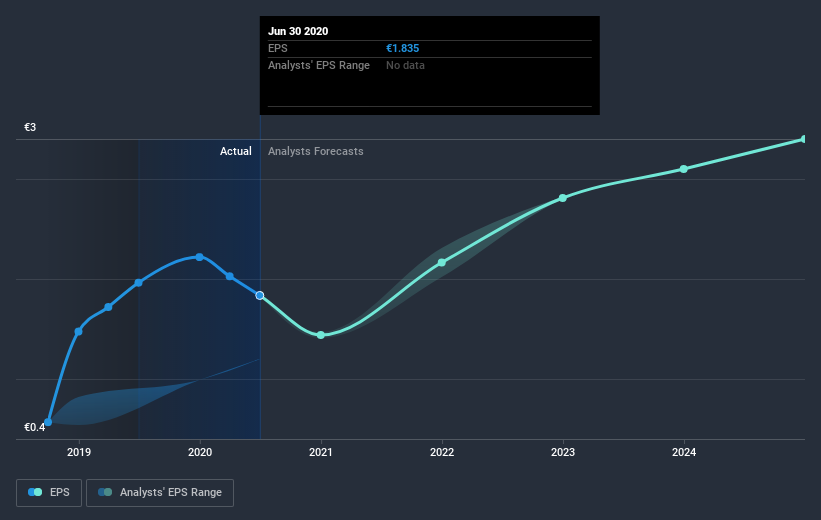
Over half a decade, Accell Group managed to grow its earnings per share at 8.2% a year. This EPS growth is higher than the 6% average annual increase in the share price. Therefore, it seems the market has become relatively pessimistic about the company.
The graphic below depicts how EPS has changed over time (unveil the exact values by clicking on the image).
Before buying or selling a stock, we always recommend a close examination of historic growth trends, available here.
What about the Total Shareholder Return (TSR)?
Investors should note that there's a difference between Accell Group's total shareholder return (TSR) and its share price change, which we've covered above. Arguably the TSR is a more complete return calculation because it accounts for the value of dividends (as if they were reinvested), along with the hypothetical value of any discounted capital that have been offered to shareholders. Its history of dividend payouts mean that Accell Group's TSR of 51% over the last 5 years is better than the share price return.
A Different Perspective
Accell Group shareholders gained a total return of 2.7% during the year. But that return falls short of the market. On the bright side, the longer term returns (running at about 9% a year, over half a decade) look better. It's quite possible the business continues to execute with prowess, even as the share price gains are slowing. It's always interesting to track share price performance over the longer term. But to understand Accell Group better, we need to consider many other factors. Like risks, for instance. Every company has them, and we've spotted 2 warning signs for Accell Group (of which 1 shouldn't be ignored!) you should know about.
If you are like me, then you will not want to miss this free list of growing companies that insiders are buying.
Please note, the market returns quoted in this article reflect the market weighted average returns of stocks that currently trade on NL exchanges.
If you’re looking to trade Accell Group, open an account with the lowest-cost* platform trusted by professionals, Interactive Brokers. Their clients from over 200 countries and territories trade stocks, options, futures, forex, bonds and funds worldwide from a single integrated account. Promoted
If you're looking to trade Accell Group, open an account with the lowest-cost platform trusted by professionals, Interactive Brokers.
With clients in over 200 countries and territories, and access to 160 markets, IBKR lets you trade stocks, options, futures, forex, bonds and funds from a single integrated account.
Enjoy no hidden fees, no account minimums, and FX conversion rates as low as 0.03%, far better than what most brokers offer.
Sponsored ContentNew: Manage All Your Stock Portfolios in One Place
We've created the ultimate portfolio companion for stock investors, and it's free.
• Connect an unlimited number of Portfolios and see your total in one currency
• Be alerted to new Warning Signs or Risks via email or mobile
• Track the Fair Value of your stocks
This article by Simply Wall St is general in nature. It does not constitute a recommendation to buy or sell any stock, and does not take account of your objectives, or your financial situation. We aim to bring you long-term focused analysis driven by fundamental data. Note that our analysis may not factor in the latest price-sensitive company announcements or qualitative material. Simply Wall St has no position in any stocks mentioned.
*Interactive Brokers Rated Lowest Cost Broker by StockBrokers.com Annual Online Review 2020
Have feedback on this article? Concerned about the content? Get in touch with us directly. Alternatively, email editorial-team@simplywallst.com.
About ENXTAM:ACCEL
Accell Group
Accell Group N.V. designs, develops, produces, and markets bicycles, bicycle parts, and accessories.
Adequate balance sheet with questionable track record.
Similar Companies
Market Insights

Community Narratives


