Advertisement
- Netherlands
- /
- Banks
- /
- ENXTAM:INGA
Is ING Groep’s 51% Share Price Surge in 2025 Backed by Real Value?

Simply Wall St
Reviewed by Bailey Pemberton
- Wondering whether ING Groep is fairly priced or hiding untapped value? You're not alone. Figuring out what's included in the current share price is on every investor's mind.
- The shares have surged an impressive 51.3% over the past year and are up 45.1% so far this year, catching the attention of growth-seekers and those watching for shifting sentiment.
- Much of this activity has been spurred by improved outlooks for European banks and optimism around interest rate trends, with investors responding to positive industry momentum and renewed confidence in the sector generally.
- Based on our checks, ING Groep scores 2 out of 6 on valuation. Traditional methods do not always paint the full picture, so let’s dig deeper to see how the real value story unfolds. Stay tuned for an even better way to size it all up.
ING Groep scores just 2/6 on our valuation checks. See what other red flags we found in the full valuation breakdown.
Approach 1: ING Groep Excess Returns Analysis
The Excess Returns model examines how much profit a company generates above its cost of capital, providing a focused view on its ability to create value for shareholders. Rather than only considering cash flows, it highlights how efficiently ING Groep puts its equity to use and the sustainability of these returns over time.
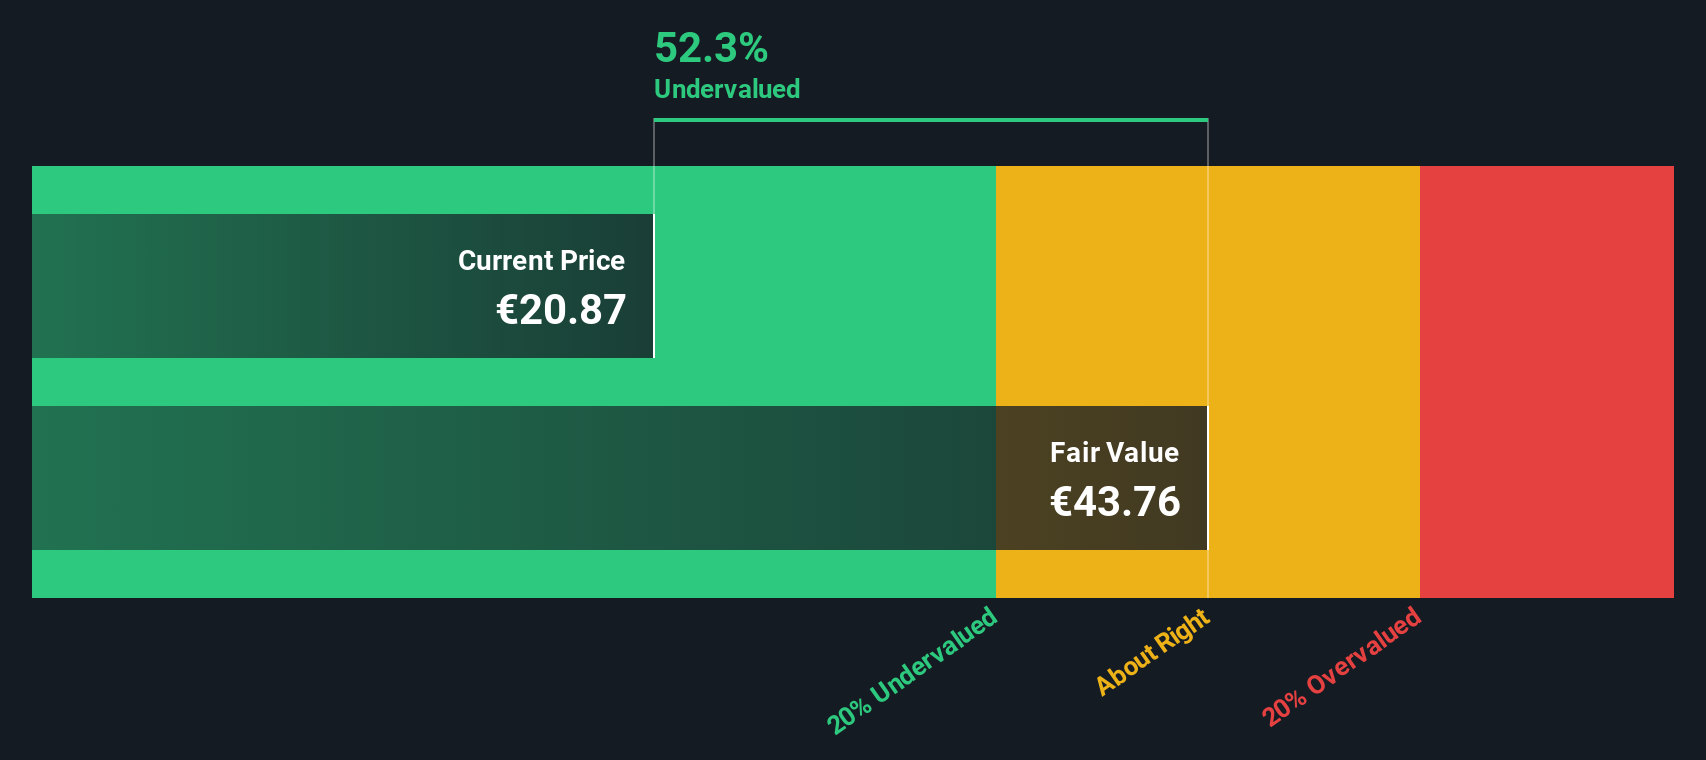
For ING Groep, the numbers are telling. The current Book Value stands at €16.84 per share, while its stable Earnings Per Share (EPS) is estimated at €2.37. These figures are derived from a consensus of 15 analysts. The Cost of Equity is €1.10 per share, resulting in an Excess Return of €1.27 per share. On average, the company achieves a Return on Equity of 13.23%, outperforming its cost of capital by a healthy margin. Looking ahead, analysts see the Book Value strengthening to €17.94 per share in stable conditions, based on input from 9 analysts.
This model indicates an intrinsic value that is 52.3% above the current share price, suggesting ING Groep stock is significantly undervalued at this time. The company’s consistent ability to earn above its cost of capital makes a strong value case, even with sector uncertainties and market swings.
Result: UNDERVALUED
Our Excess Returns analysis suggests ING Groep is undervalued by 52.3%. Track this in your watchlist or portfolio, or discover 843 more undervalued stocks based on cash flows.
Approach 2: ING Groep Price vs Earnings
The Price-to-Earnings (PE) ratio is widely used for valuing profitable companies like ING Groep, as it reflects how much investors are willing to pay today for a euro of reported earnings. For established banks with consistent profits, the PE ratio offers a direct lens into market sentiment, expectations for future growth, and risk premiums compared to industry peers.
Growth prospects and perceived risk play a big role in what is considered a “fair” PE ratio. Companies with above-average growth, solid balance sheets, or lower risk typically command higher PE multiples, while more cyclical firms or those facing industry headwinds often trade at a discount.
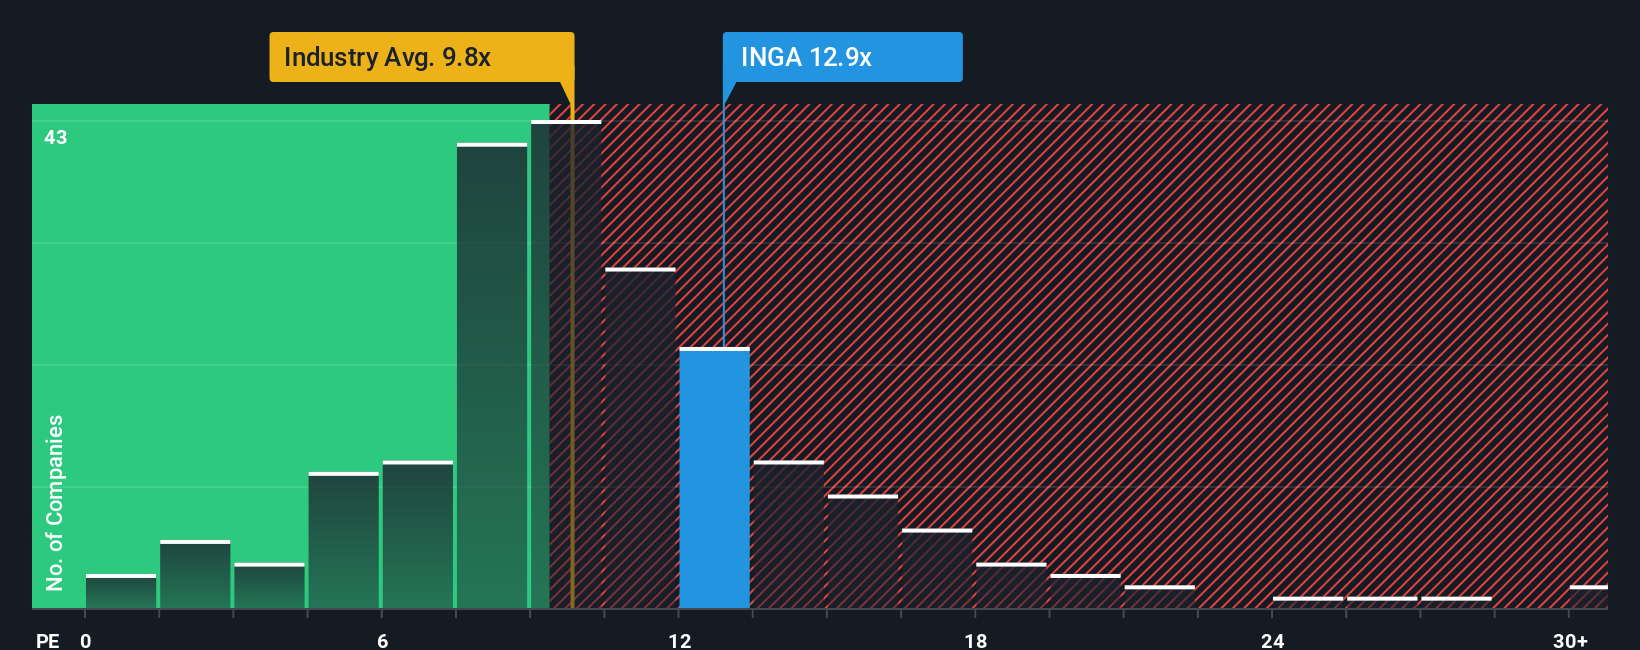
As of now, ING Groep trades on a PE ratio of 12.8x. This is above the industry average of 10.2x and higher than the average of its European banking peers at 9.3x. However, simply comparing headline numbers does not always tell the full story. Simply Wall St calculates a proprietary “Fair Ratio” of 12.3x for ING Groep. This Fair Ratio incorporates not only earnings growth outlook, but also the company’s profitability profile, sector, market cap, and risk factors, providing a more nuanced benchmark than generic peer or industry averages.
Comparing ING Groep’s actual PE of 12.8x to its Fair Ratio of 12.3x, the valuation lands just slightly above fair value, but the difference is less than 0.10, meaning the stock currently trades at a price that is about right relative to what its fundamentals suggest.
Result: ABOUT RIGHT
PE ratios tell one story, but what if the real opportunity lies elsewhere? Discover 1410 companies where insiders are betting big on explosive growth.
Upgrade Your Decision Making: Choose your ING Groep Narrative
Earlier, we mentioned there is an even better way to understand valuation, so let's introduce you to Narratives. Narratives are a user-friendly tool that lets you connect your perspective—your “story” about a company’s future—to the key numbers driving its fair value: estimates for revenue, earnings, margins, and risk.
With Narratives, you can easily map your expectations and reasoning to a forecast, instantly generating a tailored fair value for ING Groep or any company. This approach puts the company’s story and strategy front and center, linking it directly to financial outcomes in a way that numbers alone do not capture. Narratives live on Simply Wall St’s Community page, where millions of investors post, update, and compare their viewpoints in real time.
Narratives make it simple to see when your fair value estimate signals a buy or sell compared to the current market price. Plus, they update dynamically as news, earnings, and forecasts change, keeping your investment thesis fresh without extra effort.
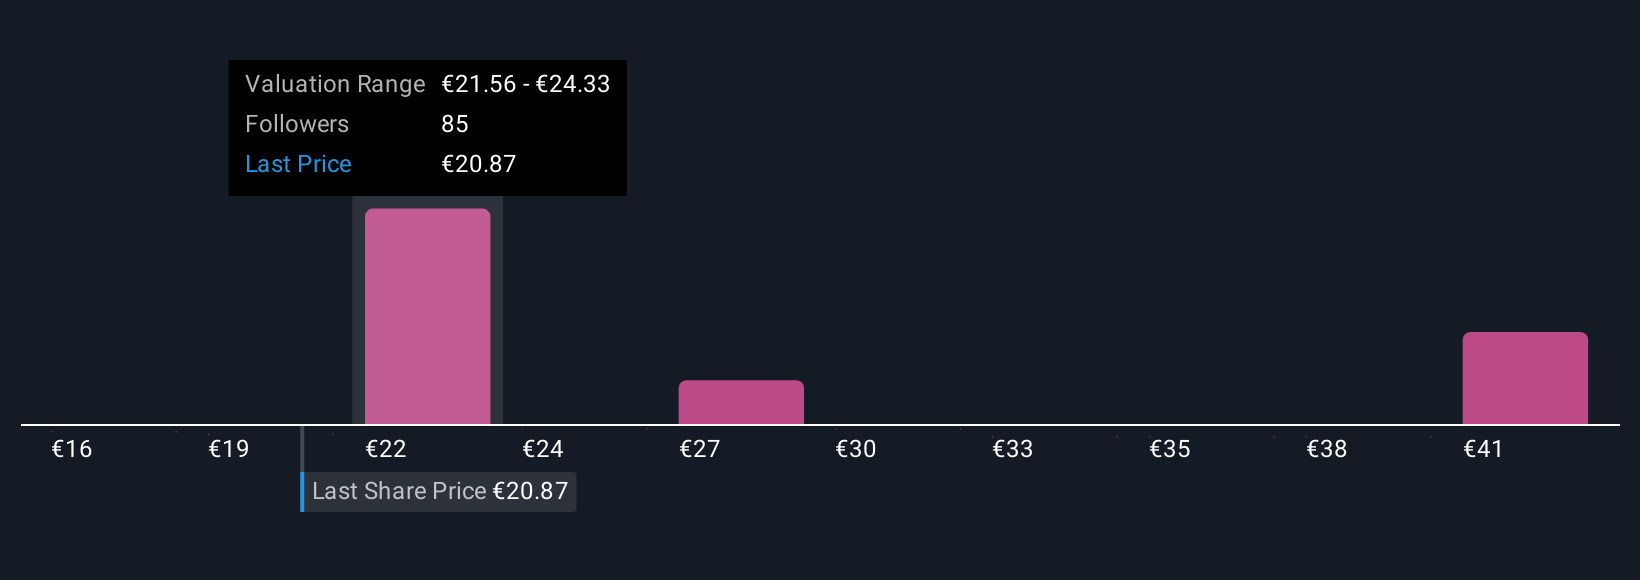
For ING Groep, you can quickly see that some investors, factoring in strong fee-based income expansion, see fair value as high as €27.92 per share, while more cautious users, focusing on tighter margins, put fair value closer to €17.50. Narratives help you invest with clarity, confidence, and your own unique insight.
Do you think there's more to the story for ING Groep? Head over to our Community to see what others are saying!
This article by Simply Wall St is general in nature. We provide commentary based on historical data and analyst forecasts only using an unbiased methodology and our articles are not intended to be financial advice. It does not constitute a recommendation to buy or sell any stock, and does not take account of your objectives, or your financial situation. We aim to bring you long-term focused analysis driven by fundamental data. Note that our analysis may not factor in the latest price-sensitive company announcements or qualitative material. Simply Wall St has no position in any stocks mentioned.
New: AI Stock Screener & Alerts
Our new AI Stock Screener scans the market every day to uncover opportunities.
• Dividend Powerhouses (3%+ Yield)
• Undervalued Small Caps with Insider Buying
• High growth Tech and AI Companies
Or build your own from over 50 metrics.
Have feedback on this article? Concerned about the content? Get in touch with us directly. Alternatively, email editorial-team@simplywallst.com
About ENXTAM:INGA
ING Groep
Provides various banking products and services in the Netherlands, Belgium, Germany, rest of Europe, and internationally.
Solid track record with adequate balance sheet and pays a dividend.
Similar Companies
Market Insights

Advertisement
Community Narratives
The company that turned a verb into a global necessity and basically runs the modern internet, digital ads, smartphones, maps, and AI.
Fair Value US$300.00|5.4% undervalued
OS
Community Contributor
Flowers Foods Pays A Fair Price For Health
Fair Value US$16.12|26.3% undervalued
NV
Community Contributor
TMX Group will thrive with 33.3% profit margin and enduring market moat
Fair Value CA$49.90|4.1% overvalued
LI
Community Contributor
The "Molecular Pencil": Why Beam's Technology is Built to Win
Fair Value US$65.01|62.7% undervalued
DA
Community Contributor