- Malaysia
- /
- Other Utilities
- /
- KLSE:YTLPOWR
Recent 4.7% pullback isn't enough to hurt long-term YTL Power International Berhad (KLSE:YTLPOWR) shareholders, they're still up 500% over 3 years

While YTL Power International Berhad (KLSE:YTLPOWR) shareholders are probably generally happy, the stock hasn't had particularly good run recently, with the share price falling 24% in the last quarter. But that doesn't change the fact that the returns over the last three years have been spectacular. Indeed, the share price is up a whopping 441% in that time. As long term investors the recent fall doesn't detract all that much from the longer term story. The thing to consider is whether there is still too much elation around the company's prospects.
Although YTL Power International Berhad has shed RM1.5b from its market cap this week, let's take a look at its longer term fundamental trends and see if they've driven returns.
Check out our latest analysis for YTL Power International Berhad
To paraphrase Benjamin Graham: Over the short term the market is a voting machine, but over the long term it's a weighing machine. One imperfect but simple way to consider how the market perception of a company has shifted is to compare the change in the earnings per share (EPS) with the share price movement.
During three years of share price growth, YTL Power International Berhad moved from a loss to profitability. Given the importance of this milestone, it's not overly surprising that the share price has increased strongly.
You can see below how EPS has changed over time (discover the exact values by clicking on the image).
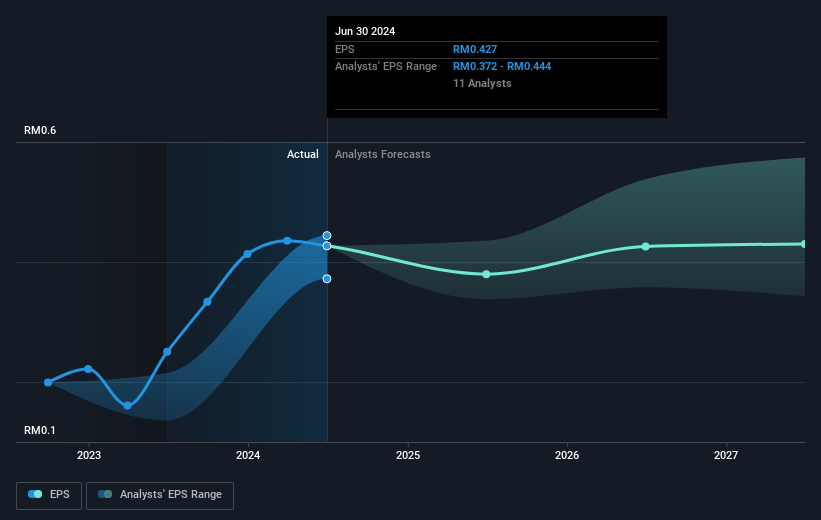
It is of course excellent to see how YTL Power International Berhad has grown profits over the years, but the future is more important for shareholders. It might be well worthwhile taking a look at our free report on how its financial position has changed over time.
What About Dividends?
When looking at investment returns, it is important to consider the difference between total shareholder return (TSR) and share price return. The TSR incorporates the value of any spin-offs or discounted capital raisings, along with any dividends, based on the assumption that the dividends are reinvested. It's fair to say that the TSR gives a more complete picture for stocks that pay a dividend. We note that for YTL Power International Berhad the TSR over the last 3 years was 500%, which is better than the share price return mentioned above. And there's no prize for guessing that the dividend payments largely explain the divergence!
A Different Perspective
It's nice to see that YTL Power International Berhad shareholders have received a total shareholder return of 82% over the last year. That's including the dividend. Since the one-year TSR is better than the five-year TSR (the latter coming in at 44% per year), it would seem that the stock's performance has improved in recent times. In the best case scenario, this may hint at some real business momentum, implying that now could be a great time to delve deeper. While it is well worth considering the different impacts that market conditions can have on the share price, there are other factors that are even more important. For instance, we've identified 3 warning signs for YTL Power International Berhad (1 shouldn't be ignored) that you should be aware of.
For those who like to find winning investments this free list of undervalued companies with recent insider purchasing, could be just the ticket.
Please note, the market returns quoted in this article reflect the market weighted average returns of stocks that currently trade on Malaysian exchanges.
New: Manage All Your Stock Portfolios in One Place
We've created the ultimate portfolio companion for stock investors, and it's free.
• Connect an unlimited number of Portfolios and see your total in one currency
• Be alerted to new Warning Signs or Risks via email or mobile
• Track the Fair Value of your stocks
Have feedback on this article? Concerned about the content? Get in touch with us directly. Alternatively, email editorial-team (at) simplywallst.com.
This article by Simply Wall St is general in nature. We provide commentary based on historical data and analyst forecasts only using an unbiased methodology and our articles are not intended to be financial advice. It does not constitute a recommendation to buy or sell any stock, and does not take account of your objectives, or your financial situation. We aim to bring you long-term focused analysis driven by fundamental data. Note that our analysis may not factor in the latest price-sensitive company announcements or qualitative material. Simply Wall St has no position in any stocks mentioned.
About KLSE:YTLPOWR
YTL Power International Berhad
An investment holding company, provides electricity, clean water, sewerage system, and telecommunication services in Malaysia, Singapore, the United Kingdom, and internationally.
Undervalued with proven track record.
Market Insights

Community Narratives


