- Malaysia
- /
- Water Utilities
- /
- KLSE:RANHILL
Did You Participate In Any Of Ranhill Utilities Berhad's (KLSE:RANHILL) Respectable 62% Return?


By buying an index fund, you can roughly match the market return with ease. But many of us dare to dream of bigger returns, and build a portfolio ourselves. Just take a look at Ranhill Utilities Berhad (KLSE:RANHILL), which is up 40%, over three years, soundly beating the market decline of 6.3% (not including dividends).
See our latest analysis for Ranhill Utilities Berhad
While markets are a powerful pricing mechanism, share prices reflect investor sentiment, not just underlying business performance. One imperfect but simple way to consider how the market perception of a company has shifted is to compare the change in the earnings per share (EPS) with the share price movement.
Ranhill Utilities Berhad was able to grow its EPS at 10% per year over three years, sending the share price higher. We don't think it is entirely coincidental that the EPS growth is reasonably close to the 12% average annual increase in the share price. This suggests that sentiment and expectations have not changed drastically. Rather, the share price has approximately tracked EPS growth.
The image below shows how EPS has tracked over time (if you click on the image you can see greater detail).
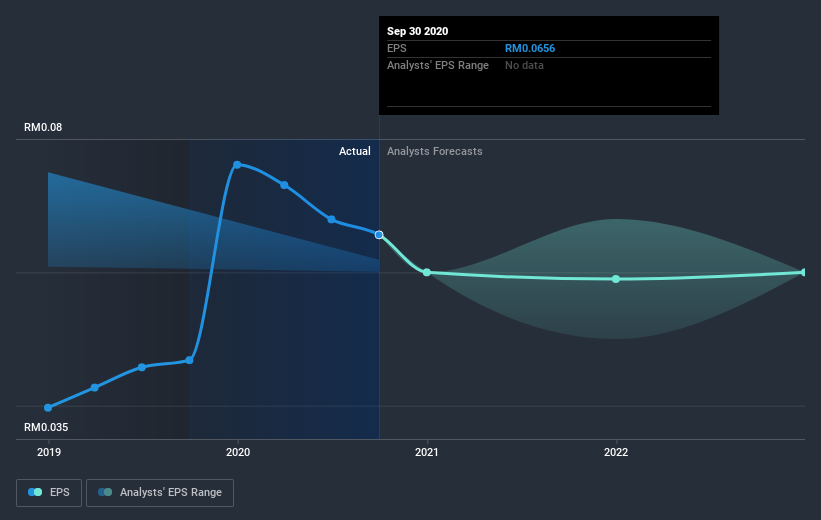
We know that Ranhill Utilities Berhad has improved its bottom line lately, but is it going to grow revenue? If you're interested, you could check this free report showing consensus revenue forecasts.
What About Dividends?
It is important to consider the total shareholder return, as well as the share price return, for any given stock. The TSR is a return calculation that accounts for the value of cash dividends (assuming that any dividend received was reinvested) and the calculated value of any discounted capital raisings and spin-offs. It's fair to say that the TSR gives a more complete picture for stocks that pay a dividend. In the case of Ranhill Utilities Berhad, it has a TSR of 62% for the last 3 years. That exceeds its share price return that we previously mentioned. The dividends paid by the company have thusly boosted the total shareholder return.
A Different Perspective
Over the last year, Ranhill Utilities Berhad shareholders took a loss of 24%, including dividends. In contrast the market gained about 9.2%. Of course the long term matters more than the short term, and even great stocks will sometimes have a poor year. Fortunately the longer term story is brighter, with total returns averaging about 17% per year over three years. The recent sell-off could be an opportunity if the business remains sound, so it may be worth checking the fundamental data for signs of a long-term growth trend. I find it very interesting to look at share price over the long term as a proxy for business performance. But to truly gain insight, we need to consider other information, too. Like risks, for instance. Every company has them, and we've spotted 3 warning signs for Ranhill Utilities Berhad (of which 2 are concerning!) you should know about.
But note: Ranhill Utilities Berhad may not be the best stock to buy. So take a peek at this free list of interesting companies with past earnings growth (and further growth forecast).
Please note, the market returns quoted in this article reflect the market weighted average returns of stocks that currently trade on MY exchanges.
If you decide to trade Ranhill Utilities Berhad, use the lowest-cost* platform that is rated #1 Overall by Barron’s, Interactive Brokers. Trade stocks, options, futures, forex, bonds and funds on 135 markets, all from a single integrated account. Promoted
New: AI Stock Screener & Alerts
Our new AI Stock Screener scans the market every day to uncover opportunities.
• Dividend Powerhouses (3%+ Yield)
• Undervalued Small Caps with Insider Buying
• High growth Tech and AI Companies
Or build your own from over 50 metrics.
This article by Simply Wall St is general in nature. It does not constitute a recommendation to buy or sell any stock, and does not take account of your objectives, or your financial situation. We aim to bring you long-term focused analysis driven by fundamental data. Note that our analysis may not factor in the latest price-sensitive company announcements or qualitative material. Simply Wall St has no position in any stocks mentioned.
*Interactive Brokers Rated Lowest Cost Broker by StockBrokers.com Annual Online Review 2020
Have feedback on this article? Concerned about the content? Get in touch with us directly. Alternatively, email editorial-team@simplywallst.com.
About KLSE:RANHILL
Ranhill Utilities Berhad
An investment holding company, operates in the environment and energy sectors in Malaysia, Thailand, Qatar, Australia, Bangladesh, Brunei, Indonesia, Abu Dhabi, Vietnam, Brazil, and internationally.
Slightly overvalued with questionable track record.
Market Insights

Community Narratives

