- Malaysia
- /
- Telecom Services and Carriers
- /
- KLSE:OCK
Would Shareholders Who Purchased OCK Group Berhad's(KLSE:OCK) Stock Three Years Be Happy With The Share price Today?


As an investor its worth striving to ensure your overall portfolio beats the market average. But if you try your hand at stock picking, your risk returning less than the market. Unfortunately, that's been the case for longer term OCK Group Berhad (KLSE:OCK) shareholders, since the share price is down 46% in the last three years, falling well short of the market decline of around 3.0%. The good news is that the stock is up 2.1% in the last week.
Check out our latest analysis for OCK Group Berhad
While markets are a powerful pricing mechanism, share prices reflect investor sentiment, not just underlying business performance. One flawed but reasonable way to assess how sentiment around a company has changed is to compare the earnings per share (EPS) with the share price.
OCK Group Berhad saw its EPS decline at a compound rate of 3.0% per year, over the last three years. The share price decline of 18% is actually steeper than the EPS slippage. So it seems the market was too confident about the business, in the past.
The graphic below depicts how EPS has changed over time (unveil the exact values by clicking on the image).
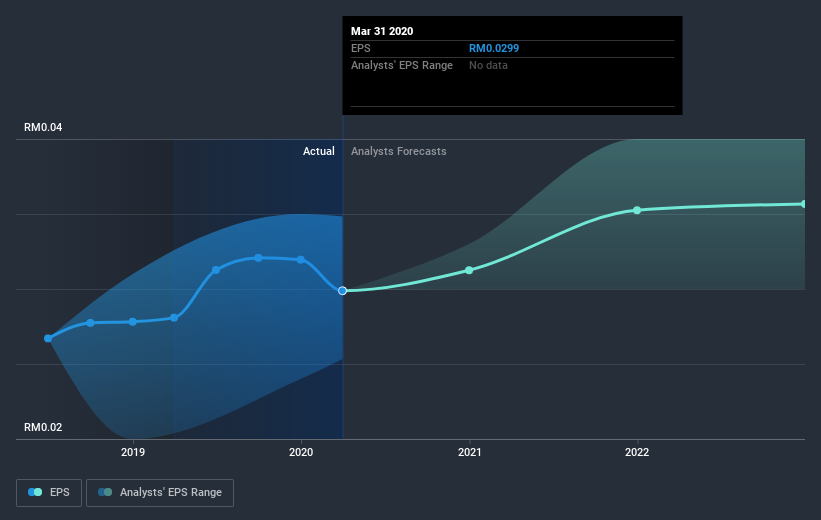
Dive deeper into OCK Group Berhad's key metrics by checking this interactive graph of OCK Group Berhad's earnings, revenue and cash flow.
What about the Total Shareholder Return (TSR)?
We'd be remiss not to mention the difference between OCK Group Berhad's total shareholder return (TSR) and its share price return. The TSR is a return calculation that accounts for the value of cash dividends (assuming that any dividend received was reinvested) and the calculated value of any discounted capital raisings and spin-offs. Dividends have been really beneficial for OCK Group Berhad shareholders, and that cash payout explains why its total shareholder loss of 45%, over the last 3 years, isn't as bad as the share price return.
A Different Perspective
Investors in OCK Group Berhad had a tough year, with a total loss of 18%, against a market gain of about 2.3%. Even the share prices of good stocks drop sometimes, but we want to see improvements in the fundamental metrics of a business, before getting too interested. Regrettably, last year's performance caps off a bad run, with the shareholders facing a total loss of 3.9% per year over five years. Generally speaking long term share price weakness can be a bad sign, though contrarian investors might want to research the stock in hope of a turnaround. I find it very interesting to look at share price over the long term as a proxy for business performance. But to truly gain insight, we need to consider other information, too. Like risks, for instance. Every company has them, and we've spotted 2 warning signs for OCK Group Berhad (of which 1 makes us a bit uncomfortable!) you should know about.
If you are like me, then you will not want to miss this free list of growing companies that insiders are buying.
Please note, the market returns quoted in this article reflect the market weighted average returns of stocks that currently trade on MY exchanges.
When trading OCK Group Berhad or any other investment, use the platform considered by many to be the Professional's Gateway to the Worlds Market, Interactive Brokers. You get the lowest-cost* trading on stocks, options, futures, forex, bonds and funds worldwide from a single integrated account. Promoted
If you're looking to trade OCK Group Berhad, open an account with the lowest-cost platform trusted by professionals, Interactive Brokers.
With clients in over 200 countries and territories, and access to 160 markets, IBKR lets you trade stocks, options, futures, forex, bonds and funds from a single integrated account.
Enjoy no hidden fees, no account minimums, and FX conversion rates as low as 0.03%, far better than what most brokers offer.
Sponsored ContentNew: AI Stock Screener & Alerts
Our new AI Stock Screener scans the market every day to uncover opportunities.
• Dividend Powerhouses (3%+ Yield)
• Undervalued Small Caps with Insider Buying
• High growth Tech and AI Companies
Or build your own from over 50 metrics.
This article by Simply Wall St is general in nature. It does not constitute a recommendation to buy or sell any stock, and does not take account of your objectives, or your financial situation. We aim to bring you long-term focused analysis driven by fundamental data. Note that our analysis may not factor in the latest price-sensitive company announcements or qualitative material. Simply Wall St has no position in any stocks mentioned.
*Interactive Brokers Rated Lowest Cost Broker by StockBrokers.com Annual Online Review 2020
Have feedback on this article? Concerned about the content? Get in touch with us directly. Alternatively, email editorial-team@simplywallst.com.
About KLSE:OCK
OCK Group Berhad
An investment holding company, provides telecommunications network services in Malaysia, Myanmar, Indonesia, Singapore, and Vietnam.
Fair value with moderate growth potential.
Market Insights

Community Narratives

