
Advertisement
- Malaysia
- /
- Wireless Telecom
- /
- KLSE:CDB
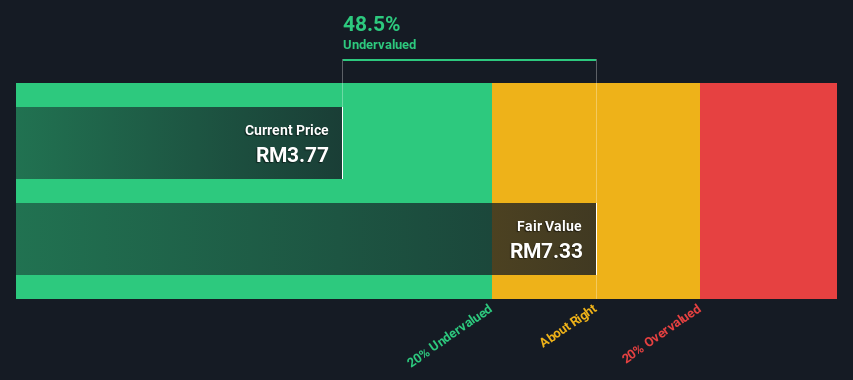
Is There An Opportunity With Celcomdigi Berhad's (KLSE:CDB) 49% Undervaluation?

Key Insights
- The projected fair value for Celcomdigi Berhad is RM7.33 based on 2 Stage Free Cash Flow to Equity
- Current share price of RM3.77 suggests Celcomdigi Berhad is potentially 49% undervalued
- Analyst price target for CDB is RM4.58 which is 37% below our fair value estimate
Does the August share price for Celcomdigi Berhad (KLSE:CDB) reflect what it's really worth? Today, we will estimate the stock's intrinsic value by taking the expected future cash flows and discounting them to their present value. Our analysis will employ the Discounted Cash Flow (DCF) model. Believe it or not, it's not too difficult to follow, as you'll see from our example!
Companies can be valued in a lot of ways, so we would point out that a DCF is not perfect for every situation. Anyone interested in learning a bit more about intrinsic value should have a read of the Simply Wall St analysis model.
See our latest analysis for Celcomdigi Berhad
The Calculation
We use what is known as a 2-stage model, which simply means we have two different periods of growth rates for the company's cash flows. Generally the first stage is higher growth, and the second stage is a lower growth phase. To start off with, we need to estimate the next ten years of cash flows. Where possible we use analyst estimates, but when these aren't available we extrapolate the previous free cash flow (FCF) from the last estimate or reported value. We assume companies with shrinking free cash flow will slow their rate of shrinkage, and that companies with growing free cash flow will see their growth rate slow, over this period. We do this to reflect that growth tends to slow more in the early years than it does in later years.
A DCF is all about the idea that a dollar in the future is less valuable than a dollar today, and so the sum of these future cash flows is then discounted to today's value:
10-year free cash flow (FCF) estimate
| 2025 | 2026 | 2027 | 2028 | 2029 | 2030 | 2031 | 2032 | 2033 | 2034 | |
| Levered FCF (MYR, Millions) | RM3.52b | RM3.89b | RM4.08b | RM4.24b | RM4.41b | RM4.58b | RM4.75b | RM4.92b | RM5.10b | RM5.29b |
| Growth Rate Estimate Source | Analyst x8 | Analyst x6 | Analyst x1 | Est @ 4.08% | Est @ 3.92% | Est @ 3.81% | Est @ 3.73% | Est @ 3.68% | Est @ 3.64% | Est @ 3.61% |
| Present Value (MYR, Millions) Discounted @ 8.0% | RM3.3k | RM3.3k | RM3.2k | RM3.1k | RM3.0k | RM2.9k | RM2.8k | RM2.7k | RM2.5k | RM2.4k |
("Est" = FCF growth rate estimated by Simply Wall St)
Present Value of 10-year Cash Flow (PVCF) = RM29b
We now need to calculate the Terminal Value, which accounts for all the future cash flows after this ten year period. The Gordon Growth formula is used to calculate Terminal Value at a future annual growth rate equal to the 5-year average of the 10-year government bond yield of 3.6%. We discount the terminal cash flows to today's value at a cost of equity of 8.0%.
Terminal Value (TV)= FCF2034 × (1 + g) ÷ (r – g) = RM5.3b× (1 + 3.6%) ÷ (8.0%– 3.6%) = RM123b
Present Value of Terminal Value (PVTV)= TV / (1 + r)10= RM123b÷ ( 1 + 8.0%)10= RM57b
The total value, or equity value, is then the sum of the present value of the future cash flows, which in this case is RM86b. To get the intrinsic value per share, we divide this by the total number of shares outstanding. Compared to the current share price of RM3.8, the company appears quite good value at a 49% discount to where the stock price trades currently. Valuations are imprecise instruments though, rather like a telescope - move a few degrees and end up in a different galaxy. Do keep this in mind.
The Assumptions
The calculation above is very dependent on two assumptions. The first is the discount rate and the other is the cash flows. You don't have to agree with these inputs, I recommend redoing the calculations yourself and playing with them. The DCF also does not consider the possible cyclicality of an industry, or a company's future capital requirements, so it does not give a full picture of a company's potential performance. Given that we are looking at Celcomdigi Berhad as potential shareholders, the cost of equity is used as the discount rate, rather than the cost of capital (or weighted average cost of capital, WACC) which accounts for debt. In this calculation we've used 8.0%, which is based on a levered beta of 0.800. Beta is a measure of a stock's volatility, compared to the market as a whole. We get our beta from the industry average beta of globally comparable companies, with an imposed limit between 0.8 and 2.0, which is a reasonable range for a stable business.
SWOT Analysis for Celcomdigi Berhad
Strength
- Earnings growth over the past year exceeded the industry.
- Debt is well covered by earnings and cashflows.
Weakness
- Dividend is low compared to the top 25% of dividend payers in the Wireless Telecom market.
Opportunity
- Annual earnings are forecast to grow faster than the Malaysian market.
- Trading below our estimate of fair value by more than 20%.
Threat
- Dividends are not covered by earnings.
- Annual revenue is forecast to grow slower than the Malaysian market.
Moving On:
Whilst important, the DCF calculation ideally won't be the sole piece of analysis you scrutinize for a company. The DCF model is not a perfect stock valuation tool. Instead the best use for a DCF model is to test certain assumptions and theories to see if they would lead to the company being undervalued or overvalued. For instance, if the terminal value growth rate is adjusted slightly, it can dramatically alter the overall result. Can we work out why the company is trading at a discount to intrinsic value? For Celcomdigi Berhad, there are three relevant elements you should look at:
- Risks: Take risks, for example - Celcomdigi Berhad has 2 warning signs we think you should be aware of.
- Future Earnings: How does CDB's growth rate compare to its peers and the wider market? Dig deeper into the analyst consensus number for the upcoming years by interacting with our free analyst growth expectation chart.
- Other Solid Businesses: Low debt, high returns on equity and good past performance are fundamental to a strong business. Why not explore our interactive list of stocks with solid business fundamentals to see if there are other companies you may not have considered!
PS. Simply Wall St updates its DCF calculation for every Malaysian stock every day, so if you want to find the intrinsic value of any other stock just search here.
New: AI Stock Screener & Alerts
Our new AI Stock Screener scans the market every day to uncover opportunities.
• Dividend Powerhouses (3%+ Yield)
• Undervalued Small Caps with Insider Buying
• High growth Tech and AI Companies
Or build your own from over 50 metrics.
Have feedback on this article? Concerned about the content? Get in touch with us directly. Alternatively, email editorial-team (at) simplywallst.com.
This article by Simply Wall St is general in nature. We provide commentary based on historical data and analyst forecasts only using an unbiased methodology and our articles are not intended to be financial advice. It does not constitute a recommendation to buy or sell any stock, and does not take account of your objectives, or your financial situation. We aim to bring you long-term focused analysis driven by fundamental data. Note that our analysis may not factor in the latest price-sensitive company announcements or qualitative material. Simply Wall St has no position in any stocks mentioned.
About KLSE:CDB
Celcomdigi Berhad
An investment holding company, provides mobile communication services and related products in Malaysia.
Mediocre balance sheet with limited growth.
Market Insights


Advertisement
Community Narratives
Alphabet: The Under-appreciated Compounder Hiding in Plain Sight
Fair Value US$282.83|31.8% undervalued
BL
Community Contributor
Planet Labs: At The Heart Of The Emerging New Space Boom
Fair Value US$11.31|44.7% undervalued
AN
Community Contributor
Exxon in Guyana 5 year forecast Low $135 to High $189
Fair Value US$174.00|35.8% undervalued
AG
Community Contributor