Investors Still Aren't Entirely Convinced By DGB Asia Berhad's (KLSE:DGB) Revenues Despite 55% Price Jump


DGB Asia Berhad (KLSE:DGB) shareholders would be excited to see that the share price has had a great month, posting a 55% gain and recovering from prior weakness. Unfortunately, despite the strong performance over the last month, the full year gain of 3.3% isn't as attractive.
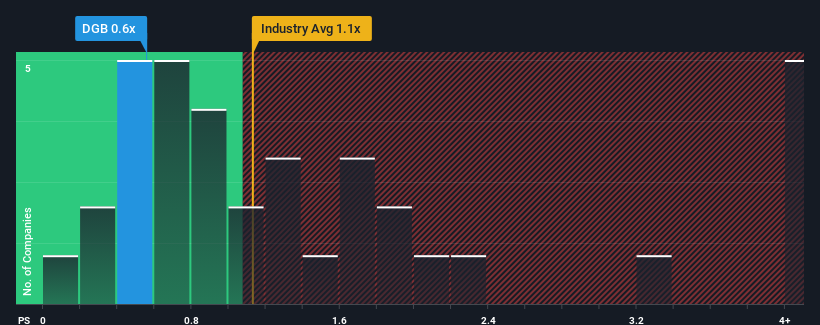
Although its price has surged higher, when close to half the companies operating in Malaysia's Electronic industry have price-to-sales ratios (or "P/S") above 1.1x, you may still consider DGB Asia Berhad as an enticing stock to check out with its 0.6x P/S ratio. However, the P/S might be low for a reason and it requires further investigation to determine if it's justified.
Check out our latest analysis for DGB Asia Berhad
What Does DGB Asia Berhad's P/S Mean For Shareholders?
With revenue growth that's exceedingly strong of late, DGB Asia Berhad has been doing very well. Perhaps the market is expecting future revenue performance to dwindle, which has kept the P/S suppressed. Those who are bullish on DGB Asia Berhad will be hoping that this isn't the case, so that they can pick up the stock at a lower valuation.
We don't have analyst forecasts, but you can see how recent trends are setting up the company for the future by checking out our free report on DGB Asia Berhad's earnings, revenue and cash flow.What Are Revenue Growth Metrics Telling Us About The Low P/S?
In order to justify its P/S ratio, DGB Asia Berhad would need to produce sluggish growth that's trailing the industry.
If we review the last year of revenue growth, the company posted a terrific increase of 81%. Spectacularly, three year revenue growth has ballooned by several orders of magnitude, thanks in part to the last 12 months of revenue growth. Accordingly, shareholders would have been over the moon with those medium-term rates of revenue growth.
Comparing that recent medium-term revenue trajectory with the industry's one-year growth forecast of 23% shows it's noticeably more attractive.
With this information, we find it odd that DGB Asia Berhad is trading at a P/S lower than the industry. Apparently some shareholders believe the recent performance has exceeded its limits and have been accepting significantly lower selling prices.
What We Can Learn From DGB Asia Berhad's P/S?
Despite DGB Asia Berhad's share price climbing recently, its P/S still lags most other companies. Using the price-to-sales ratio alone to determine if you should sell your stock isn't sensible, however it can be a practical guide to the company's future prospects.
We're very surprised to see DGB Asia Berhad currently trading on a much lower than expected P/S since its recent three-year growth is higher than the wider industry forecast. When we see strong revenue with faster-than-industry growth, we assume there are some significant underlying risks to the company's ability to make money which is applying downwards pressure on the P/S ratio. At least price risks look to be very low if recent medium-term revenue trends continue, but investors seem to think future revenue could see a lot of volatility.
And what about other risks? Every company has them, and we've spotted 5 warning signs for DGB Asia Berhad (of which 4 are potentially serious!) you should know about.
If strong companies turning a profit tickle your fancy, then you'll want to check out this free list of interesting companies that trade on a low P/E (but have proven they can grow earnings).
New: Manage All Your Stock Portfolios in One Place
We've created the ultimate portfolio companion for stock investors, and it's free.
• Connect an unlimited number of Portfolios and see your total in one currency
• Be alerted to new Warning Signs or Risks via email or mobile
• Track the Fair Value of your stocks
Have feedback on this article? Concerned about the content? Get in touch with us directly. Alternatively, email editorial-team (at) simplywallst.com.
This article by Simply Wall St is general in nature. We provide commentary based on historical data and analyst forecasts only using an unbiased methodology and our articles are not intended to be financial advice. It does not constitute a recommendation to buy or sell any stock, and does not take account of your objectives, or your financial situation. We aim to bring you long-term focused analysis driven by fundamental data. Note that our analysis may not factor in the latest price-sensitive company announcements or qualitative material. Simply Wall St has no position in any stocks mentioned.
About KLSE:DGB
DGB Asia Berhad
An investment holding company, engages in the development and provision of software and engineering consultancy for automated identification and data collection (AIDC) in Malaysia and Taiwan.
Adequate balance sheet slight.
