
Advertisement
Investors Don't See Light At End Of Nexgram Holdings Berhad's (KLSE:NEXGRAM) Tunnel And Push Stock Down 29%
To the annoyance of some shareholders, Nexgram Holdings Berhad (KLSE:NEXGRAM) shares are down a considerable 29% in the last month, which continues a horrid run for the company. Instead of being rewarded, shareholders who have already held through the last twelve months are now sitting on a 29% share price drop.
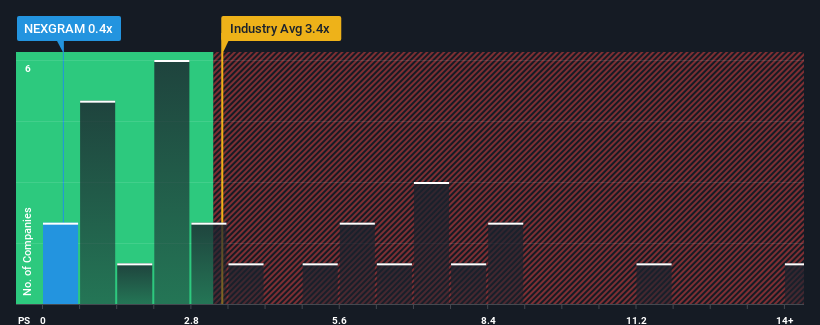
Following the heavy fall in price, Nexgram Holdings Berhad's price-to-sales (or "P/S") ratio of 0.4x might make it look like a strong buy right now compared to the wider Software industry in Malaysia, where around half of the companies have P/S ratios above 3.4x and even P/S above 7x are quite common. Although, it's not wise to just take the P/S at face value as there may be an explanation why it's so limited.
Check out our latest analysis for Nexgram Holdings Berhad
How Has Nexgram Holdings Berhad Performed Recently?
Nexgram Holdings Berhad certainly has been doing a great job lately as it's been growing its revenue at a really rapid pace. It might be that many expect the strong revenue performance to degrade substantially, which has repressed the P/S ratio. Those who are bullish on Nexgram Holdings Berhad will be hoping that this isn't the case, so that they can pick up the stock at a lower valuation.
Although there are no analyst estimates available for Nexgram Holdings Berhad, take a look at this free data-rich visualisation to see how the company stacks up on earnings, revenue and cash flow.Do Revenue Forecasts Match The Low P/S Ratio?
There's an inherent assumption that a company should far underperform the industry for P/S ratios like Nexgram Holdings Berhad's to be considered reasonable.
Taking a look back first, we see that the company grew revenue by an impressive 54% last year. Revenue has also lifted 16% in aggregate from three years ago, mostly thanks to the last 12 months of growth. Accordingly, shareholders would have probably been satisfied with the medium-term rates of revenue growth.
Comparing the recent medium-term revenue trends against the industry's one-year growth forecast of 27% shows it's noticeably less attractive.
With this in consideration, it's easy to understand why Nexgram Holdings Berhad's P/S falls short of the mark set by its industry peers. Apparently many shareholders weren't comfortable holding on to something they believe will continue to trail the wider industry.
The Final Word
Shares in Nexgram Holdings Berhad have plummeted and its P/S has followed suit. It's argued the price-to-sales ratio is an inferior measure of value within certain industries, but it can be a powerful business sentiment indicator.
In line with expectations, Nexgram Holdings Berhad maintains its low P/S on the weakness of its recent three-year growth being lower than the wider industry forecast. Right now shareholders are accepting the low P/S as they concede future revenue probably won't provide any pleasant surprises. If recent medium-term revenue trends continue, it's hard to see the share price experience a reversal of fortunes anytime soon.
Plus, you should also learn about these 3 warning signs we've spotted with Nexgram Holdings Berhad.
If you're unsure about the strength of Nexgram Holdings Berhad's business, why not explore our interactive list of stocks with solid business fundamentals for some other companies you may have missed.
Valuation is complex, but we're here to simplify it.
Discover if Nexgram Holdings Berhad might be undervalued or overvalued with our detailed analysis, featuring fair value estimates, potential risks, dividends, insider trades, and its financial condition.
Access Free AnalysisHave feedback on this article? Concerned about the content? Get in touch with us directly. Alternatively, email editorial-team (at) simplywallst.com.
This article by Simply Wall St is general in nature. We provide commentary based on historical data and analyst forecasts only using an unbiased methodology and our articles are not intended to be financial advice. It does not constitute a recommendation to buy or sell any stock, and does not take account of your objectives, or your financial situation. We aim to bring you long-term focused analysis driven by fundamental data. Note that our analysis may not factor in the latest price-sensitive company announcements or qualitative material. Simply Wall St has no position in any stocks mentioned.
About KLSE:NEXGRAM
Nexgram Holdings Berhad
An investment holding company, provides information technology services in Malaysia and Indonesia.
Flawless balance sheet and slightly overvalued.
Market Insights

Advertisement
Community Narratives
Kodiak AI - a potential 100 bagger opportunity?
Fair Value US$14.00|44.7% undervalued
DA
Community Contributor
A Fair Price for a Great Business Facing Real Threats
Fair Value US$383.06|13.0% undervalued
IM
Community Contributor
AXON And Shopify Integration Will Unlock Global Mobile Advertising
Fair Value US$646.30|0% overvalued
AN
Based on Analyst Price Targets