Do Its Financials Have Any Role To Play In Driving Excel Force MSC Berhad's (KLSE:EFORCE) Stock Up Recently?


Most readers would already be aware that Excel Force MSC Berhad's (KLSE:EFORCE) stock increased significantly by 14% over the past month. We wonder if and what role the company's financials play in that price change as a company's long-term fundamentals usually dictate market outcomes. In this article, we decided to focus on Excel Force MSC Berhad's ROE.
Return on equity or ROE is an important factor to be considered by a shareholder because it tells them how effectively their capital is being reinvested. In other words, it is a profitability ratio which measures the rate of return on the capital provided by the company's shareholders.
View our latest analysis for Excel Force MSC Berhad
How Is ROE Calculated?
Return on equity can be calculated by using the formula:
Return on Equity = Net Profit (from continuing operations) ÷ Shareholders' Equity
So, based on the above formula, the ROE for Excel Force MSC Berhad is:
8.0% = RM8.6m ÷ RM107m (Based on the trailing twelve months to December 2022).
The 'return' is the income the business earned over the last year. Another way to think of that is that for every MYR1 worth of equity, the company was able to earn MYR0.08 in profit.
What Has ROE Got To Do With Earnings Growth?
We have already established that ROE serves as an efficient profit-generating gauge for a company's future earnings. Based on how much of its profits the company chooses to reinvest or "retain", we are then able to evaluate a company's future ability to generate profits. Generally speaking, other things being equal, firms with a high return on equity and profit retention, have a higher growth rate than firms that don’t share these attributes.
A Side By Side comparison of Excel Force MSC Berhad's Earnings Growth And 8.0% ROE
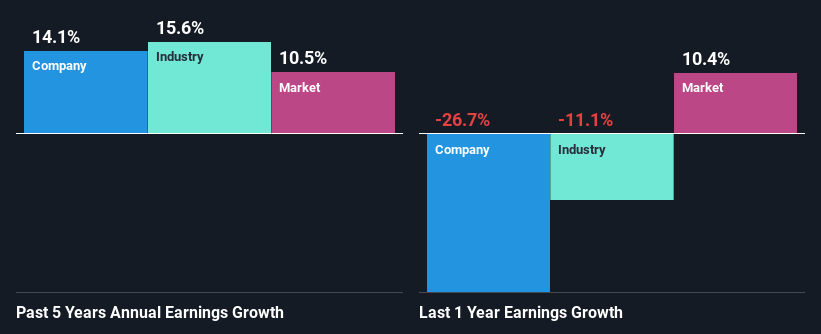
On the face of it, Excel Force MSC Berhad's ROE is not much to talk about. However, its ROE is similar to the industry average of 8.2%, so we won't completely dismiss the company. Even so, Excel Force MSC Berhad has shown a fairly decent growth in its net income which grew at a rate of 14%. Considering the moderately low ROE, it is quite possible that there might be some other aspects that are positively influencing the company's earnings growth. For instance, the company has a low payout ratio or is being managed efficiently.
Next, on comparing Excel Force MSC Berhad's net income growth with the industry, we found that the company's reported growth is similar to the industry average growth rate of 16% in the same period.
Earnings growth is a huge factor in stock valuation. It’s important for an investor to know whether the market has priced in the company's expected earnings growth (or decline). By doing so, they will have an idea if the stock is headed into clear blue waters or if swampy waters await. One good indicator of expected earnings growth is the P/E ratio which determines the price the market is willing to pay for a stock based on its earnings prospects. So, you may want to check if Excel Force MSC Berhad is trading on a high P/E or a low P/E, relative to its industry.
Is Excel Force MSC Berhad Efficiently Re-investing Its Profits?
The high three-year median payout ratio of 67% (or a retention ratio of 33%) for Excel Force MSC Berhad suggests that the company's growth wasn't really hampered despite it returning most of its income to its shareholders.
Besides, Excel Force MSC Berhad has been paying dividends for at least ten years or more. This shows that the company is committed to sharing profits with its shareholders.
Conclusion
In total, it does look like Excel Force MSC Berhad has some positive aspects to its business. Namely, its high earnings growth. We do however feel that the earnings growth number could have been even higher, had the company been reinvesting more of its earnings and paid out less dividends. Until now, we have only just grazed the surface of the company's past performance by looking at the company's fundamentals. You can do your own research on Excel Force MSC Berhad and see how it has performed in the past by looking at this FREE detailed graph of past earnings, revenue and cash flows.
If you're looking to trade Excel Force MSC Berhad, open an account with the lowest-cost platform trusted by professionals, Interactive Brokers.
With clients in over 200 countries and territories, and access to 160 markets, IBKR lets you trade stocks, options, futures, forex, bonds and funds from a single integrated account.
Enjoy no hidden fees, no account minimums, and FX conversion rates as low as 0.03%, far better than what most brokers offer.
Sponsored ContentValuation is complex, but we're here to simplify it.
Discover if Excel Force MSC Berhad might be undervalued or overvalued with our detailed analysis, featuring fair value estimates, potential risks, dividends, insider trades, and its financial condition.
Access Free AnalysisHave feedback on this article? Concerned about the content? Get in touch with us directly. Alternatively, email editorial-team (at) simplywallst.com.
This article by Simply Wall St is general in nature. We provide commentary based on historical data and analyst forecasts only using an unbiased methodology and our articles are not intended to be financial advice. It does not constitute a recommendation to buy or sell any stock, and does not take account of your objectives, or your financial situation. We aim to bring you long-term focused analysis driven by fundamental data. Note that our analysis may not factor in the latest price-sensitive company announcements or qualitative material. Simply Wall St has no position in any stocks mentioned.
About KLSE:EFORCE
Excel Force MSC Berhad
Develops, provides, and maintains software application solutions for the financial services industry in Malaysia.
Adequate balance sheet slight.
Similar Companies
Market Insights

Community Narratives

