
Advertisement
- Malaysia
- /
- Semiconductors
- /
- KLSE:TTVHB
TT Vision Holdings Berhad's (KLSE:TTVHB) 26% Jump Shows Its Popularity With Investors
Despite an already strong run, TT Vision Holdings Berhad (KLSE:TTVHB) shares have been powering on, with a gain of 26% in the last thirty days. But the gains over the last month weren't enough to make shareholders whole, as the share price is still down 5.0% in the last twelve months.
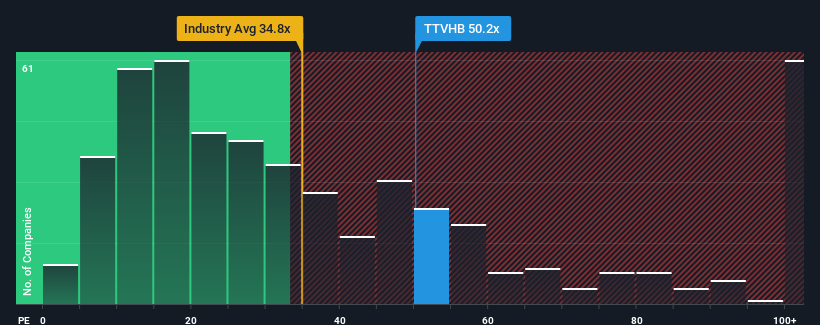
Following the firm bounce in price, TT Vision Holdings Berhad may be sending very bearish signals at the moment with a price-to-earnings (or "P/E") ratio of 50.2x, since almost half of all companies in Malaysia have P/E ratios under 16x and even P/E's lower than 10x are not unusual. Nonetheless, we'd need to dig a little deeper to determine if there is a rational basis for the highly elevated P/E.
For example, consider that TT Vision Holdings Berhad's financial performance has been poor lately as its earnings have been in decline. It might be that many expect the company to still outplay most other companies over the coming period, which has kept the P/E from collapsing. You'd really hope so, otherwise you're paying a pretty hefty price for no particular reason.
See our latest analysis for TT Vision Holdings Berhad
What Are Growth Metrics Telling Us About The High P/E?
There's an inherent assumption that a company should far outperform the market for P/E ratios like TT Vision Holdings Berhad's to be considered reasonable.
Retrospectively, the last year delivered a frustrating 14% decrease to the company's bottom line. Even so, admirably EPS has lifted 338% in aggregate from three years ago, notwithstanding the last 12 months. So we can start by confirming that the company has generally done a very good job of growing earnings over that time, even though it had some hiccups along the way.
Comparing that to the market, which is only predicted to deliver 17% growth in the next 12 months, the company's momentum is stronger based on recent medium-term annualised earnings results.
With this information, we can see why TT Vision Holdings Berhad is trading at such a high P/E compared to the market. Presumably shareholders aren't keen to offload something they believe will continue to outmanoeuvre the bourse.
The Key Takeaway
Shares in TT Vision Holdings Berhad have built up some good momentum lately, which has really inflated its P/E. Typically, we'd caution against reading too much into price-to-earnings ratios when settling on investment decisions, though it can reveal plenty about what other market participants think about the company.
As we suspected, our examination of TT Vision Holdings Berhad revealed its three-year earnings trends are contributing to its high P/E, given they look better than current market expectations. At this stage investors feel the potential for a deterioration in earnings isn't great enough to justify a lower P/E ratio. If recent medium-term earnings trends continue, it's hard to see the share price falling strongly in the near future under these circumstances.
The company's balance sheet is another key area for risk analysis. You can assess many of the main risks through our free balance sheet analysis for TT Vision Holdings Berhad with six simple checks.
If you're unsure about the strength of TT Vision Holdings Berhad's business, why not explore our interactive list of stocks with solid business fundamentals for some other companies you may have missed.
Valuation is complex, but we're here to simplify it.
Discover if TT Vision Holdings Berhad might be undervalued or overvalued with our detailed analysis, featuring fair value estimates, potential risks, dividends, insider trades, and its financial condition.
Access Free AnalysisHave feedback on this article? Concerned about the content? Get in touch with us directly. Alternatively, email editorial-team (at) simplywallst.com.
This article by Simply Wall St is general in nature. We provide commentary based on historical data and analyst forecasts only using an unbiased methodology and our articles are not intended to be financial advice. It does not constitute a recommendation to buy or sell any stock, and does not take account of your objectives, or your financial situation. We aim to bring you long-term focused analysis driven by fundamental data. Note that our analysis may not factor in the latest price-sensitive company announcements or qualitative material. Simply Wall St has no position in any stocks mentioned.
About KLSE:TTVHB
TT Vision Holdings Berhad
An investment holding company, engages in the development, manufacture, and sale of machine vision equipment, and related products and services.
Excellent balance sheet with proven track record.
Similar Companies
Market Insights

Advertisement
Weekly Picks
RO


RockeTeller on Santacruz Silver Mining ·
Crazy Undervalued 42 Baggers Silver Play (Active & Running Mine)
Fair Value:CA$8696.7% undervalued
16 followersusers have followed this narrative
5 commentsusers have commented on this narrative
3 likesusers have liked this narrative
RO


Robbo on Fiducian Group ·
Fiducian: Compliance Clouds or Value Opportunity?
Fair Value:AU$126.1% undervalued
3 followersusers have followed this narrative
0 commentsusers have commented on this narrative
0 likesusers have liked this narrative
WO

woodworthfund on Willamette Valley Vineyards ·
Willamette Valley Vineyards (WVVI): Not-So-Great Value
Fair Value:US$242.5% overvalued
2 followersusers have followed this narrative
0 commentsusers have commented on this narrative
1 likeusers have liked this narrative
Recently Updated Narratives
MA


MarkoVT on Alphabet ·
Positioned globally, partnered locally
Fair Value:US$390.1919.1% undervalued
1 followerusers have followed this narrative
0 commentsusers have commented on this narrative
0 likesusers have liked this narrative
JO


JohnJ on Worldline ·
When will fraudsters be investigated in depth. Fraud was ongoing in France too.
Fair Value:€0.5200.8% overvalued
1 followerusers have followed this narrative
0 commentsusers have commented on this narrative
0 likesusers have liked this narrative
MA

MarkoVT on Applied Digital ·
Staggered by dilution; positions for growth
Fair Value:US$35.4520.9% undervalued
4 followersusers have followed this narrative
0 commentsusers have commented on this narrative
0 likesusers have liked this narrative
Popular Narratives
TH


TheWallstreetKing on MicroVision ·
MicroVision will explode future revenue by 380.37% with a vision towards success
Fair Value:US$6098.6% undervalued
112 followersusers have followed this narrative
11 commentsusers have commented on this narrative
22 likesusers have liked this narrative
AN


AnalystConsensusTarget on NVIDIA ·
NVDA: Expanding AI Demand Will Drive Major Data Center Investments Through 2026
Fair Value:US$250.3927.5% undervalued
948 followersusers have followed this narrative
6 commentsusers have commented on this narrative
24 likesusers have liked this narrative
OS

oscargarcia on Alphabet ·
The company that turned a verb into a global necessity and basically runs the modern internet, digital ads, smartphones, maps, and AI.
Fair Value:US$3407.1% undervalued
148 followersusers have followed this narrative
6 commentsusers have commented on this narrative
18 likesusers have liked this narrative

