
Advertisement
- Malaysia
- /
- Real Estate
- /
- KLSE:SPSETIA
S P Setia Berhad (KLSE:SPSETIA) stock performs better than its underlying earnings growth over last five years

It hasn't been the best quarter for S P Setia Berhad (KLSE:SPSETIA) shareholders, since the share price has fallen 15% in that time. On the bright side the returns have been quite good over the last half decade. Its return of 48% has certainly bested the market return! Unfortunately not all shareholders will have held it for the long term, so spare a thought for those caught in the 23% decline over the last twelve months.
The past week has proven to be lucrative for S P Setia Berhad investors, so let's see if fundamentals drove the company's five-year performance.
To paraphrase Benjamin Graham: Over the short term the market is a voting machine, but over the long term it's a weighing machine. By comparing earnings per share (EPS) and share price changes over time, we can get a feel for how investor attitudes to a company have morphed over time.
Over half a decade, S P Setia Berhad managed to grow its earnings per share at 12% a year. The EPS growth is more impressive than the yearly share price gain of 8% over the same period. So it seems the market isn't so enthusiastic about the stock these days.
You can see below how EPS has changed over time (discover the exact values by clicking on the image).
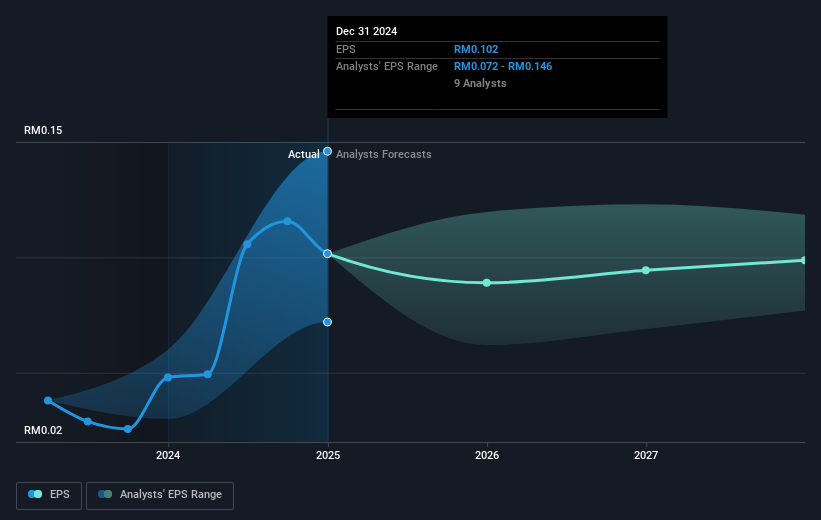
We know that S P Setia Berhad has improved its bottom line over the last three years, but what does the future have in store? Take a more thorough look at S P Setia Berhad's financial health with this free report on its balance sheet.
What About Dividends?
As well as measuring the share price return, investors should also consider the total shareholder return (TSR). The TSR is a return calculation that accounts for the value of cash dividends (assuming that any dividend received was reinvested) and the calculated value of any discounted capital raisings and spin-offs. So for companies that pay a generous dividend, the TSR is often a lot higher than the share price return. As it happens, S P Setia Berhad's TSR for the last 5 years was 58%, which exceeds the share price return mentioned earlier. The dividends paid by the company have thusly boosted the total shareholder return.
A Different Perspective
We regret to report that S P Setia Berhad shareholders are down 21% for the year (even including dividends). Unfortunately, that's worse than the broader market decline of 4.2%. Having said that, it's inevitable that some stocks will be oversold in a falling market. The key is to keep your eyes on the fundamental developments. Longer term investors wouldn't be so upset, since they would have made 10%, each year, over five years. It could be that the recent sell-off is an opportunity, so it may be worth checking the fundamental data for signs of a long term growth trend. It's always interesting to track share price performance over the longer term. But to understand S P Setia Berhad better, we need to consider many other factors. Consider for instance, the ever-present spectre of investment risk. We've identified 2 warning signs with S P Setia Berhad (at least 1 which can't be ignored) , and understanding them should be part of your investment process.
If you like to buy stocks alongside management, then you might just love this free list of companies. (Hint: many of them are unnoticed AND have attractive valuation).
Please note, the market returns quoted in this article reflect the market weighted average returns of stocks that currently trade on Malaysian exchanges.
New: Manage All Your Stock Portfolios in One Place
We've created the ultimate portfolio companion for stock investors, and it's free.
• Connect an unlimited number of Portfolios and see your total in one currency
• Be alerted to new Warning Signs or Risks via email or mobile
• Track the Fair Value of your stocks
Have feedback on this article? Concerned about the content? Get in touch with us directly. Alternatively, email editorial-team (at) simplywallst.com.
This article by Simply Wall St is general in nature. We provide commentary based on historical data and analyst forecasts only using an unbiased methodology and our articles are not intended to be financial advice. It does not constitute a recommendation to buy or sell any stock, and does not take account of your objectives, or your financial situation. We aim to bring you long-term focused analysis driven by fundamental data. Note that our analysis may not factor in the latest price-sensitive company announcements or qualitative material. Simply Wall St has no position in any stocks mentioned.
About KLSE:SPSETIA
S P Setia Berhad
An investment holding company, operates as a property development and investment company in Malaysia, Singapore, Australia, Vietnam, the United Kingdom, and Japan.
Flawless balance sheet with solid track record.
Market Insights


Advertisement
Community Narratives
The Future of Drug Testing? Fingerprint Tech Shows Serious Promise
Fair Value US$2.98|40.3% undervalued
JO
Community Contributor
Suncorp’s Next Chapter: Insurance-Only and Ready to Grow
Fair Value AU$22.83|7.9% undervalued
RO
Community Contributor
Thyssenkrupp Nucera Will Achieve Double-Digit Profits by 2030 Boosted by Hydrogen Growth
Fair Value €14.40|31.6% undervalued
CH
Community Contributor
Tesla’s Nvidia Moment – The AI & Robotics Inflection Point
Fair Value US$359.72|12.3% undervalued
BL
Community Contributor