
Advertisement
- Malaysia
- /
- Real Estate
- /
- KLSE:SAPRES
A Piece Of The Puzzle Missing From Sapura Resources Berhad's (KLSE:SAPRES) 28% Share Price Climb
Sapura Resources Berhad (KLSE:SAPRES) shareholders have had their patience rewarded with a 28% share price jump in the last month. Not all shareholders will be feeling jubilant, since the share price is still down a very disappointing 11% in the last twelve months.
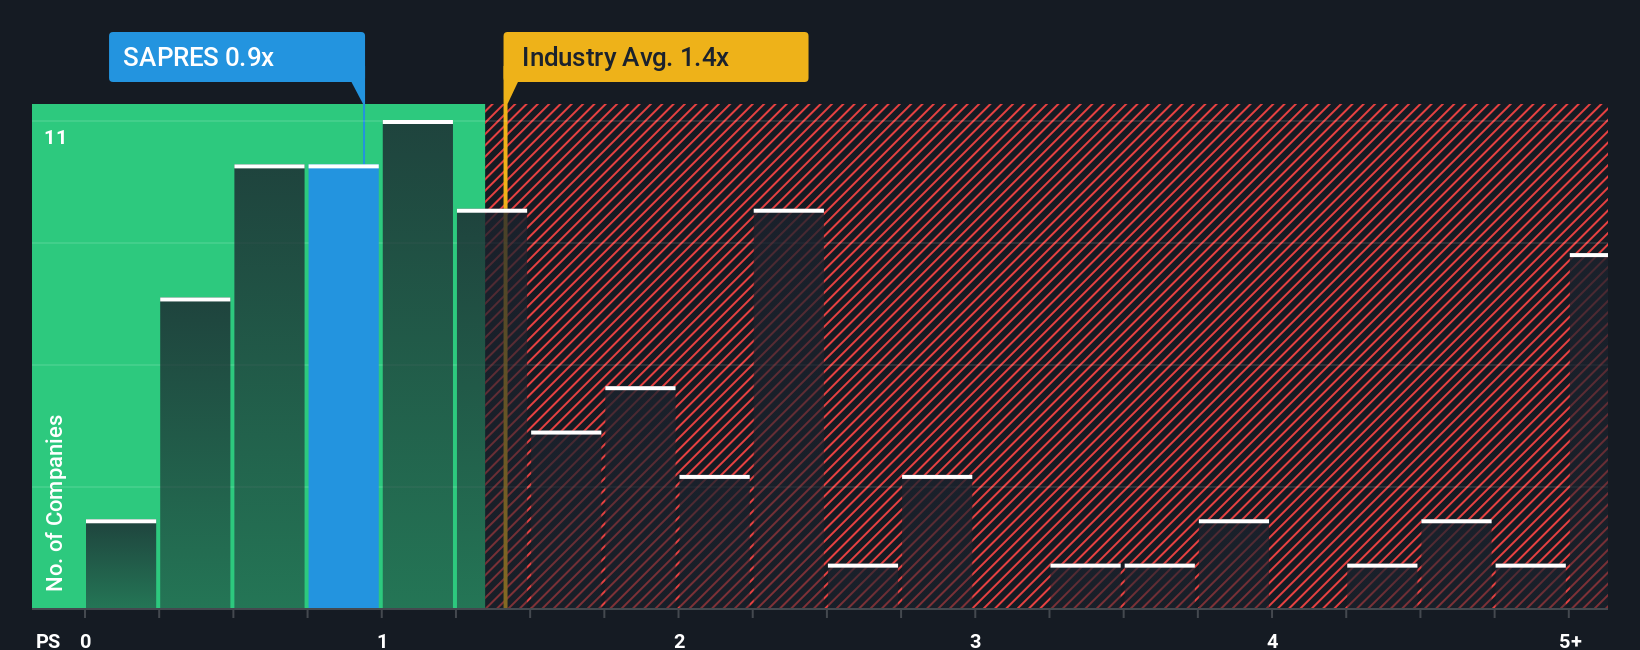
Even after such a large jump in price, it's still not a stretch to say that Sapura Resources Berhad's price-to-sales (or "P/S") ratio of 0.9x right now seems quite "middle-of-the-road" compared to the Real Estate industry in Malaysia, where the median P/S ratio is around 1.4x. However, investors might be overlooking a clear opportunity or potential setback if there is no rational basis for the P/S.
See our latest analysis for Sapura Resources Berhad
How Sapura Resources Berhad Has Been Performing
Revenue has risen firmly for Sapura Resources Berhad recently, which is pleasing to see. It might be that many expect the respectable revenue performance to wane, which has kept the P/S from rising. Those who are bullish on Sapura Resources Berhad will be hoping that this isn't the case, so that they can pick up the stock at a lower valuation.
Want the full picture on earnings, revenue and cash flow for the company? Then our free report on Sapura Resources Berhad will help you shine a light on its historical performance.What Are Revenue Growth Metrics Telling Us About The P/S?
In order to justify its P/S ratio, Sapura Resources Berhad would need to produce growth that's similar to the industry.
Retrospectively, the last year delivered a decent 12% gain to the company's revenues. Spectacularly, three year revenue growth has ballooned by several orders of magnitude, even though the last 12 months were fairly tame in comparison. Accordingly, shareholders would have been over the moon with those medium-term rates of revenue growth.
This is in contrast to the rest of the industry, which is expected to grow by 11% over the next year, materially lower than the company's recent medium-term annualised growth rates.
In light of this, it's curious that Sapura Resources Berhad's P/S sits in line with the majority of other companies. It may be that most investors are not convinced the company can maintain its recent growth rates.
The Bottom Line On Sapura Resources Berhad's P/S
Sapura Resources Berhad appears to be back in favour with a solid price jump bringing its P/S back in line with other companies in the industry Typically, we'd caution against reading too much into price-to-sales ratios when settling on investment decisions, though it can reveal plenty about what other market participants think about the company.
To our surprise, Sapura Resources Berhad revealed its three-year revenue trends aren't contributing to its P/S as much as we would have predicted, given they look better than current industry expectations. When we see strong revenue with faster-than-industry growth, we can only assume potential risks are what might be placing pressure on the P/S ratio. At least the risk of a price drop looks to be subdued if recent medium-term revenue trends continue, but investors seem to think future revenue could see some volatility.
Before you take the next step, you should know about the 2 warning signs for Sapura Resources Berhad (1 is significant!) that we have uncovered.
If you're unsure about the strength of Sapura Resources Berhad's business, why not explore our interactive list of stocks with solid business fundamentals for some other companies you may have missed.
New: Manage All Your Stock Portfolios in One Place
We've created the ultimate portfolio companion for stock investors, and it's free.
• Connect an unlimited number of Portfolios and see your total in one currency
• Be alerted to new Warning Signs or Risks via email or mobile
• Track the Fair Value of your stocks
Have feedback on this article? Concerned about the content? Get in touch with us directly. Alternatively, email editorial-team (at) simplywallst.com.
This article by Simply Wall St is general in nature. We provide commentary based on historical data and analyst forecasts only using an unbiased methodology and our articles are not intended to be financial advice. It does not constitute a recommendation to buy or sell any stock, and does not take account of your objectives, or your financial situation. We aim to bring you long-term focused analysis driven by fundamental data. Note that our analysis may not factor in the latest price-sensitive company announcements or qualitative material. Simply Wall St has no position in any stocks mentioned.
About KLSE:SAPRES
Sapura Resources Berhad
An investment holding company, engages in property investment activities in Malaysia.
Good value with adequate balance sheet.
Market Insights

Advertisement
Weekly Picks
WO

woodworthfund on MGP Ingredients ·
THE KINGDOM OF BROWN GOODS: WHY MGPI IS BEING CRUSHED BY INVENTORY & PRIMED FOR RESURRECTION
Fair Value:US$4034.1% undervalued
19 followersusers have followed this narrative
1 commentusers have commented on this narrative
5 likesusers have liked this narrative
DO


Double_Bubbler on Vertical Aerospace ·
Why Vertical Aerospace (NYSE: EVTL) is Worth Possibly Over 13x its Current Price
Fair Value:US$6090.0% undervalued
22 followersusers have followed this narrative
2 commentsusers have commented on this narrative
17 likesusers have liked this narrative
TI


TickerTickle on Oracle ·
The Quiet Giant That Became AI’s Power Grid
Fair Value:US$389.8142.8% undervalued
42 followersusers have followed this narrative
3 commentsusers have commented on this narrative
8 likesusers have liked this narrative
Recently Updated Narratives
MH


mhbb on Mastersystem Infotama ·
Mastersystem Infotama will achieve 18.9% revenue growth as fair value hits IDR1,650
Fair Value:Rp1.63k13.8% undervalued
1 followerusers have followed this narrative
0 commentsusers have commented on this narrative
0 likesusers have liked this narrative
RO


Robbo on Procter & Gamble ·
Insiders Sell, Investors Watch: What’s Going On at PG?
Fair Value:US$1506.8% undervalued
2 followersusers have followed this narrative
0 commentsusers have commented on this narrative
0 likesusers have liked this narrative
CW

Cwburton on Verano Holdings ·
Waiting for the Inevitable
Fair Value:CA$5.5278.8% undervalued
2 followersusers have followed this narrative
0 commentsusers have commented on this narrative
0 likesusers have liked this narrative
Popular Narratives
TH


TheWallstreetKing on MicroVision ·
MicroVision will explode future revenue by 380.37% with a vision towards success
Fair Value:US$6098.5% undervalued
119 followersusers have followed this narrative
11 commentsusers have commented on this narrative
22 likesusers have liked this narrative
AN


AnalystConsensusTarget on NVIDIA ·
NVDA: Expanding AI Demand Will Drive Major Data Center Investments Through 2026
Fair Value:US$250.3926.6% undervalued
963 followersusers have followed this narrative
6 commentsusers have commented on this narrative
25 likesusers have liked this narrative
RO


RockeTeller on Santacruz Silver Mining ·
Crazy Undervalued 42 Baggers Silver Play (Active & Running Mine)
Fair Value:CA$8684.3% undervalued
77 followersusers have followed this narrative
8 commentsusers have commented on this narrative
21 likesusers have liked this narrative
Trending Discussion

OI


OilStates on Oil States International ·
The article’s takeaways do not reflect Oil States’ current business mix or market realities. Nearly 75% of Company revenues now come from offshore and international projects, where industry investment is strengthening, not declining, and backlog is at the highest level in a decade. Oil States has intentionally exited lower-margin U.S. land markets, resulting in expanding margins, strong free cash flow, and a near-zero net-debt profile. Our offerings are concentrated in high-barrier, engineered offshore technologies where competitive pressure and regulatory risk are far lower than implied. These fundamentals therefore do not align with the structural-decline narrative presented. Find out more about the strong offshore/international, cash generation, and valuation upside potential in our latest investor presentation available here: https://ir.oilstatesintl.com/events-and-presentations/default.aspx
0
|0