Investors more bullish on RGT Berhad (KLSE:RGTBHD) this week as stock pops 11%, despite earnings trending downwards over past five years


Stock pickers are generally looking for stocks that will outperform the broader market. And while active stock picking involves risks (and requires diversification) it can also provide excess returns. For example, long term RGT Berhad (KLSE:RGTBHD) shareholders have enjoyed a 47% share price rise over the last half decade, well in excess of the market return of around 0.4% (not including dividends).
Since the stock has added RM26m to its market cap in the past week alone, let's see if underlying performance has been driving long-term returns.
Check out our latest analysis for RGT Berhad
While RGT Berhad made a small profit, in the last year, we think that the market is probably more focussed on the top line growth at the moment. As a general rule, we think this kind of company is more comparable to loss-making stocks, since the actual profit is so low. It would be hard to believe in a more profitable future without growing revenues.
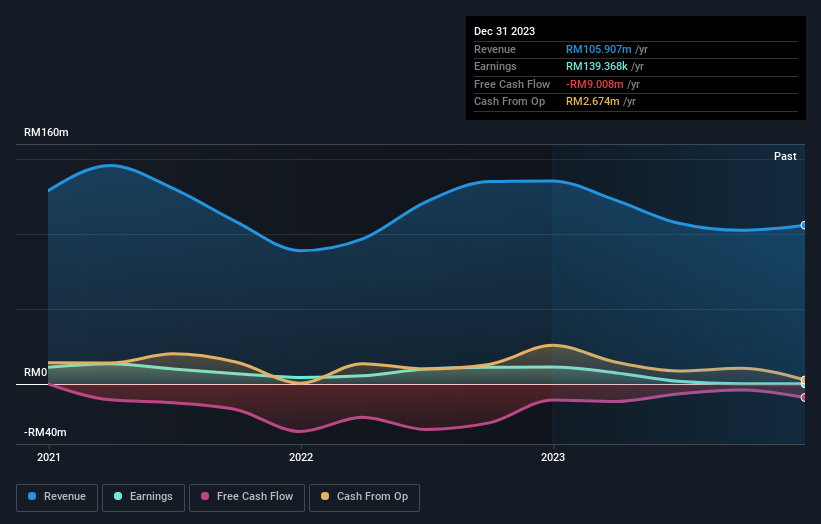
In the last 5 years RGT Berhad saw its revenue grow at 7.4% per year. That's a fairly respectable growth rate. Revenue has been growing at a reasonable clip, so it's debatable whether the share price growth of 8% full reflects the underlying business growth. If revenue growth can maintain for long enough, it's likely profits will flow. Lack of earnings means you have to project further into the future justify the valuation on the basis of future free cash flow.
The image below shows how earnings and revenue have tracked over time (if you click on the image you can see greater detail).
Balance sheet strength is crucial. It might be well worthwhile taking a look at our free report on how its financial position has changed over time.
What About Dividends?
When looking at investment returns, it is important to consider the difference between total shareholder return (TSR) and share price return. The TSR incorporates the value of any spin-offs or discounted capital raisings, along with any dividends, based on the assumption that the dividends are reinvested. It's fair to say that the TSR gives a more complete picture for stocks that pay a dividend. As it happens, RGT Berhad's TSR for the last 5 years was 57%, which exceeds the share price return mentioned earlier. This is largely a result of its dividend payments!
A Different Perspective
Investors in RGT Berhad had a tough year, with a total loss of 13% (including dividends), against a market gain of about 15%. Even the share prices of good stocks drop sometimes, but we want to see improvements in the fundamental metrics of a business, before getting too interested. On the bright side, long term shareholders have made money, with a gain of 9% per year over half a decade. It could be that the recent sell-off is an opportunity, so it may be worth checking the fundamental data for signs of a long term growth trend. It's always interesting to track share price performance over the longer term. But to understand RGT Berhad better, we need to consider many other factors. For example, we've discovered 4 warning signs for RGT Berhad (2 shouldn't be ignored!) that you should be aware of before investing here.
If you like to buy stocks alongside management, then you might just love this free list of companies. (Hint: insiders have been buying them).
Please note, the market returns quoted in this article reflect the market weighted average returns of stocks that currently trade on Malaysian exchanges.
New: AI Stock Screener & Alerts
Our new AI Stock Screener scans the market every day to uncover opportunities.
• Dividend Powerhouses (3%+ Yield)
• Undervalued Small Caps with Insider Buying
• High growth Tech and AI Companies
Or build your own from over 50 metrics.
Have feedback on this article? Concerned about the content? Get in touch with us directly. Alternatively, email editorial-team (at) simplywallst.com.
This article by Simply Wall St is general in nature. We provide commentary based on historical data and analyst forecasts only using an unbiased methodology and our articles are not intended to be financial advice. It does not constitute a recommendation to buy or sell any stock, and does not take account of your objectives, or your financial situation. We aim to bring you long-term focused analysis driven by fundamental data. Note that our analysis may not factor in the latest price-sensitive company announcements or qualitative material. Simply Wall St has no position in any stocks mentioned.
About KLSE:RGTBHD
RGT Berhad
An investment holding company, designs, manufactures, and sells moulded plastic products in Malaysia, North America, Europe, other Asian countries, and internationally.
Slight with acceptable track record.
Market Insights

Community Narratives


