- Malaysia
- /
- Metals and Mining
- /
- KLSE:PA
The 13% return this week takes P.A. Resources Berhad's (KLSE:PA) shareholders five-year gains to 118%

When you buy shares in a company, it's worth keeping in mind the possibility that it could fail, and you could lose your money. But on a lighter note, a good company can see its share price rise well over 100%. For instance, the price of P.A. Resources Berhad (KLSE:PA) stock is up an impressive 108% over the last five years. Better yet, the share price has risen 13% in the last week.
Since the stock has added RM45m to its market cap in the past week alone, let's see if underlying performance has been driving long-term returns.
View our latest analysis for P.A. Resources Berhad
To quote Buffett, 'Ships will sail around the world but the Flat Earth Society will flourish. There will continue to be wide discrepancies between price and value in the marketplace...' By comparing earnings per share (EPS) and share price changes over time, we can get a feel for how investor attitudes to a company have morphed over time.
During the five years of share price growth, P.A. Resources Berhad moved from a loss to profitability. Sometimes, the start of profitability is a major inflection point that can signal fast earnings growth to come, which in turn justifies very strong share price gains. Given that the company made a profit three years ago, but not five years ago, it is worth looking at the share price returns over the last three years, too. Indeed, the P.A. Resources Berhad share price has gained 3.8% in three years. During the same period, EPS grew by 34% each year. This EPS growth is higher than the 1.3% average annual increase in the share price over the same three years. Therefore, it seems the market has moderated its expectations for growth, somewhat.
The graphic below depicts how EPS has changed over time (unveil the exact values by clicking on the image).
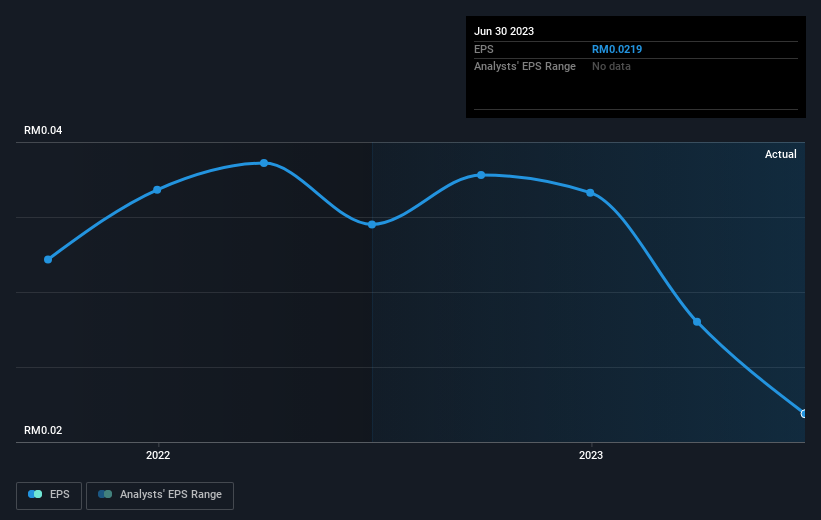
Dive deeper into P.A. Resources Berhad's key metrics by checking this interactive graph of P.A. Resources Berhad's earnings, revenue and cash flow.
What About Dividends?
It is important to consider the total shareholder return, as well as the share price return, for any given stock. The TSR is a return calculation that accounts for the value of cash dividends (assuming that any dividend received was reinvested) and the calculated value of any discounted capital raisings and spin-offs. Arguably, the TSR gives a more comprehensive picture of the return generated by a stock. We note that for P.A. Resources Berhad the TSR over the last 5 years was 118%, which is better than the share price return mentioned above. The dividends paid by the company have thusly boosted the total shareholder return.
A Different Perspective
P.A. Resources Berhad provided a TSR of 8.0% over the year (including dividends). That's fairly close to the broader market return. We should note here that the five-year TSR is more impressive, at 17% per year. More recently, the share price growth has slowed. But it has to be said the overall picture is one of good long term and short term performance. Arguably that makes P.A. Resources Berhad a stock worth watching. While it is well worth considering the different impacts that market conditions can have on the share price, there are other factors that are even more important. To that end, you should be aware of the 4 warning signs we've spotted with P.A. Resources Berhad .
For those who like to find winning investments this free list of growing companies with recent insider purchasing, could be just the ticket.
Please note, the market returns quoted in this article reflect the market weighted average returns of stocks that currently trade on Malaysian exchanges.
New: Manage All Your Stock Portfolios in One Place
We've created the ultimate portfolio companion for stock investors, and it's free.
• Connect an unlimited number of Portfolios and see your total in one currency
• Be alerted to new Warning Signs or Risks via email or mobile
• Track the Fair Value of your stocks
Have feedback on this article? Concerned about the content? Get in touch with us directly. Alternatively, email editorial-team (at) simplywallst.com.
This article by Simply Wall St is general in nature. We provide commentary based on historical data and analyst forecasts only using an unbiased methodology and our articles are not intended to be financial advice. It does not constitute a recommendation to buy or sell any stock, and does not take account of your objectives, or your financial situation. We aim to bring you long-term focused analysis driven by fundamental data. Note that our analysis may not factor in the latest price-sensitive company announcements or qualitative material. Simply Wall St has no position in any stocks mentioned.
About KLSE:PA
P.A. Resources Berhad
An investment holding company, provides aluminum extrusion, fabrication, and related services primarily in Malaysia and the United States.
Flawless balance sheet with solid track record.
Market Insights

Community Narratives

