Asia Poly Holdings Berhad (KLSE:ASIAPLY) Stock Rockets 28% But Many Are Still Ignoring The Company


Asia Poly Holdings Berhad (KLSE:ASIAPLY) shareholders would be excited to see that the share price has had a great month, posting a 28% gain and recovering from prior weakness. The annual gain comes to 129% following the latest surge, making investors sit up and take notice.
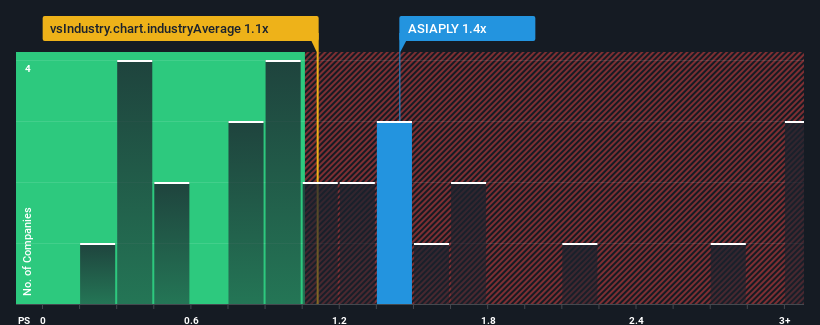
In spite of the firm bounce in price, you could still be forgiven for feeling indifferent about Asia Poly Holdings Berhad's P/S ratio of 1.4x, since the median price-to-sales (or "P/S") ratio for the Chemicals industry in Malaysia is also close to 1.1x. However, investors might be overlooking a clear opportunity or potential setback if there is no rational basis for the P/S.
Check out our latest analysis for Asia Poly Holdings Berhad
How Has Asia Poly Holdings Berhad Performed Recently?
Revenue has risen at a steady rate over the last year for Asia Poly Holdings Berhad, which is generally not a bad outcome. Perhaps the expectation moving forward is that the revenue growth will track in line with the wider industry for the near term, which has kept the P/S subdued. Those who are bullish on Asia Poly Holdings Berhad will be hoping that this isn't the case, so that they can pick up the stock at a lower valuation.
Although there are no analyst estimates available for Asia Poly Holdings Berhad, take a look at this free data-rich visualisation to see how the company stacks up on earnings, revenue and cash flow.Do Revenue Forecasts Match The P/S Ratio?
There's an inherent assumption that a company should be matching the industry for P/S ratios like Asia Poly Holdings Berhad's to be considered reasonable.
Retrospectively, the last year delivered a decent 5.6% gain to the company's revenues. Pleasingly, revenue has also lifted 39% in aggregate from three years ago, partly thanks to the last 12 months of growth. Accordingly, shareholders would have definitely welcomed those medium-term rates of revenue growth.
Comparing that recent medium-term revenue trajectory with the industry's one-year growth forecast of 3.6% shows it's noticeably more attractive.
With this information, we find it interesting that Asia Poly Holdings Berhad is trading at a fairly similar P/S compared to the industry. Apparently some shareholders believe the recent performance is at its limits and have been accepting lower selling prices.
The Key Takeaway
Its shares have lifted substantially and now Asia Poly Holdings Berhad's P/S is back within range of the industry median. While the price-to-sales ratio shouldn't be the defining factor in whether you buy a stock or not, it's quite a capable barometer of revenue expectations.
We've established that Asia Poly Holdings Berhad currently trades on a lower than expected P/S since its recent three-year growth is higher than the wider industry forecast. When we see strong revenue with faster-than-industry growth, we can only assume potential risks are what might be placing pressure on the P/S ratio. It appears some are indeed anticipating revenue instability, because the persistence of these recent medium-term conditions would normally provide a boost to the share price.
Before you take the next step, you should know about the 4 warning signs for Asia Poly Holdings Berhad (3 can't be ignored!) that we have uncovered.
It's important to make sure you look for a great company, not just the first idea you come across. So if growing profitability aligns with your idea of a great company, take a peek at this free list of interesting companies with strong recent earnings growth (and a low P/E).
If you're looking to trade Asia Poly Holdings Berhad, open an account with the lowest-cost platform trusted by professionals, Interactive Brokers.
With clients in over 200 countries and territories, and access to 160 markets, IBKR lets you trade stocks, options, futures, forex, bonds and funds from a single integrated account.
Enjoy no hidden fees, no account minimums, and FX conversion rates as low as 0.03%, far better than what most brokers offer.
Sponsored ContentNew: Manage All Your Stock Portfolios in One Place
We've created the ultimate portfolio companion for stock investors, and it's free.
• Connect an unlimited number of Portfolios and see your total in one currency
• Be alerted to new Warning Signs or Risks via email or mobile
• Track the Fair Value of your stocks
Have feedback on this article? Concerned about the content? Get in touch with us directly. Alternatively, email editorial-team (at) simplywallst.com.
This article by Simply Wall St is general in nature. We provide commentary based on historical data and analyst forecasts only using an unbiased methodology and our articles are not intended to be financial advice. It does not constitute a recommendation to buy or sell any stock, and does not take account of your objectives, or your financial situation. We aim to bring you long-term focused analysis driven by fundamental data. Note that our analysis may not factor in the latest price-sensitive company announcements or qualitative material. Simply Wall St has no position in any stocks mentioned.
About KLSE:ASIAPLY
Asia Poly Holdings Berhad
An investment holding company, engages in the manufacture and sale of cell cast acrylic sheets.
Slight with mediocre balance sheet.
Market Insights

Community Narratives


