
Advertisement
Here's Why TDM Berhad (KLSE:TDM) Is Weighed Down By Its Debt Load
The external fund manager backed by Berkshire Hathaway's Charlie Munger, Li Lu, makes no bones about it when he says 'The biggest investment risk is not the volatility of prices, but whether you will suffer a permanent loss of capital.' It's only natural to consider a company's balance sheet when you examine how risky it is, since debt is often involved when a business collapses. We can see that TDM Berhad (KLSE:TDM) does use debt in its business. But is this debt a concern to shareholders?
When Is Debt A Problem?
Debt assists a business until the business has trouble paying it off, either with new capital or with free cash flow. Ultimately, if the company can't fulfill its legal obligations to repay debt, shareholders could walk away with nothing. However, a more frequent (but still costly) occurrence is where a company must issue shares at bargain-basement prices, permanently diluting shareholders, just to shore up its balance sheet. Of course, plenty of companies use debt to fund growth, without any negative consequences. The first thing to do when considering how much debt a business uses is to look at its cash and debt together.
See our latest analysis for TDM Berhad
How Much Debt Does TDM Berhad Carry?
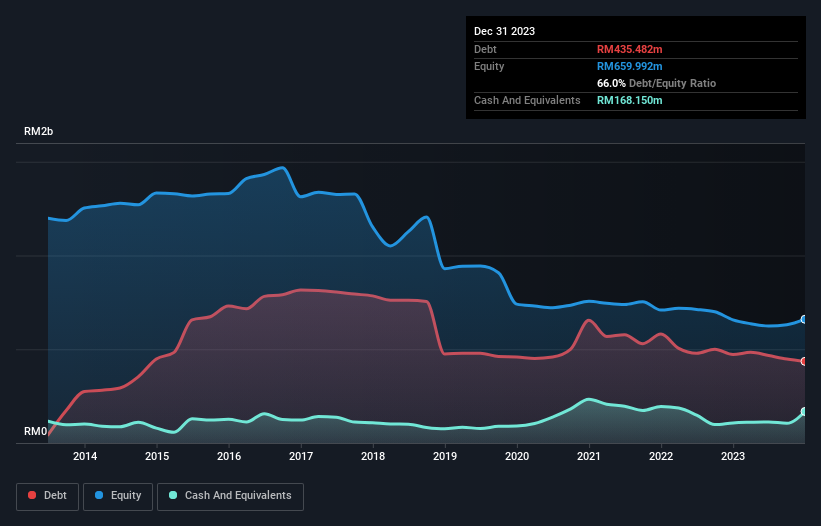
You can click the graphic below for the historical numbers, but it shows that TDM Berhad had RM435.5m of debt in December 2023, down from RM471.9m, one year before. On the flip side, it has RM168.2m in cash leading to net debt of about RM267.3m.
How Strong Is TDM Berhad's Balance Sheet?
The latest balance sheet data shows that TDM Berhad had liabilities of RM378.6m due within a year, and liabilities of RM683.8m falling due after that. Offsetting these obligations, it had cash of RM168.2m as well as receivables valued at RM90.9m due within 12 months. So its liabilities outweigh the sum of its cash and (near-term) receivables by RM803.3m.
The deficiency here weighs heavily on the RM370.4m company itself, as if a child were struggling under the weight of an enormous back-pack full of books, his sports gear, and a trumpet. So we definitely think shareholders need to watch this one closely. At the end of the day, TDM Berhad would probably need a major re-capitalization if its creditors were to demand repayment.
We measure a company's debt load relative to its earnings power by looking at its net debt divided by its earnings before interest, tax, depreciation, and amortization (EBITDA) and by calculating how easily its earnings before interest and tax (EBIT) cover its interest expense (interest cover). The advantage of this approach is that we take into account both the absolute quantum of debt (with net debt to EBITDA) and the actual interest expenses associated with that debt (with its interest cover ratio).
While we wouldn't worry about TDM Berhad's net debt to EBITDA ratio of 3.1, we think its super-low interest cover of 0.89 times is a sign of high leverage. In large part that's due to the company's significant depreciation and amortisation charges, which arguably mean its EBITDA is a very generous measure of earnings, and its debt may be more of a burden than it first appears. It seems clear that the cost of borrowing money is negatively impacting returns for shareholders, of late. Worse, TDM Berhad's EBIT was down 29% over the last year. If earnings keep going like that over the long term, it has a snowball's chance in hell of paying off that debt. When analysing debt levels, the balance sheet is the obvious place to start. But you can't view debt in total isolation; since TDM Berhad will need earnings to service that debt. So when considering debt, it's definitely worth looking at the earnings trend. Click here for an interactive snapshot.
Finally, a business needs free cash flow to pay off debt; accounting profits just don't cut it. So we always check how much of that EBIT is translated into free cash flow. Over the last three years, TDM Berhad saw substantial negative free cash flow, in total. While investors are no doubt expecting a reversal of that situation in due course, it clearly does mean its use of debt is more risky.
Our View
To be frank both TDM Berhad's EBIT growth rate and its track record of staying on top of its total liabilities make us rather uncomfortable with its debt levels. And furthermore, its interest cover also fails to instill confidence. Considering everything we've mentioned above, it's fair to say that TDM Berhad is carrying heavy debt load. If you harvest honey without a bee suit, you risk getting stung, so we'd probably stay away from this particular stock. The balance sheet is clearly the area to focus on when you are analysing debt. But ultimately, every company can contain risks that exist outside of the balance sheet. These risks can be hard to spot. Every company has them, and we've spotted 4 warning signs for TDM Berhad (of which 2 make us uncomfortable!) you should know about.
If you're interested in investing in businesses that can grow profits without the burden of debt, then check out this free list of growing businesses that have net cash on the balance sheet.
Valuation is complex, but we're here to simplify it.
Discover if TDM Berhad might be undervalued or overvalued with our detailed analysis, featuring fair value estimates, potential risks, dividends, insider trades, and its financial condition.
Access Free AnalysisHave feedback on this article? Concerned about the content? Get in touch with us directly. Alternatively, email editorial-team (at) simplywallst.com.
This article by Simply Wall St is general in nature. We provide commentary based on historical data and analyst forecasts only using an unbiased methodology and our articles are not intended to be financial advice. It does not constitute a recommendation to buy or sell any stock, and does not take account of your objectives, or your financial situation. We aim to bring you long-term focused analysis driven by fundamental data. Note that our analysis may not factor in the latest price-sensitive company announcements or qualitative material. Simply Wall St has no position in any stocks mentioned.
About KLSE:TDM
TDM Berhad
An investment holding company, engages in the cultivation of oil palms in Malaysia.
Fair value with moderate growth potential.
Similar Companies
Market Insights

Advertisement
Community Narratives
A formidable player in AI and enterprise computing.
Fair Value US$210.00|12.2% overvalued
CO
Community Contributor
IREN's Bold Moves in Sustainable Bitcoin Mining & AI Data Centers
Fair Value US$72.52|17.1% undervalued
BL
Community Contributor
Cooling the Champions: The Aussie Tech Behind F1's Victories
Fair Value AU$12.40|38.7% undervalued
TR
Community Contributor