
Advertisement
Calculating The Fair Value Of Kuala Lumpur Kepong Berhad (KLSE:KLK)
Key Insights
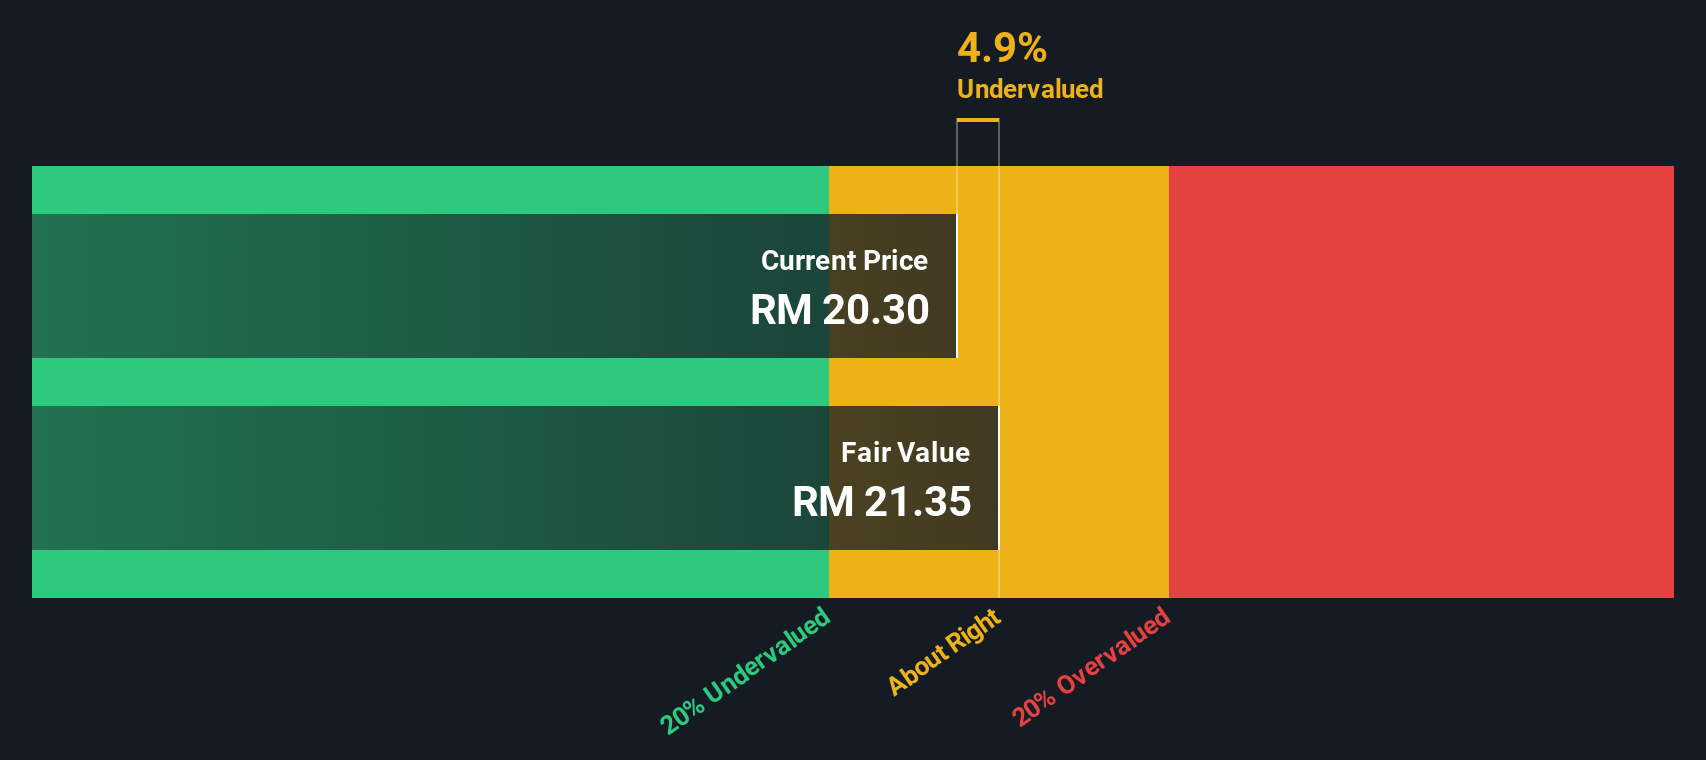
- Using the 2 Stage Free Cash Flow to Equity, Kuala Lumpur Kepong Berhad fair value estimate is RM21.35
- With RM20.30 share price, Kuala Lumpur Kepong Berhad appears to be trading close to its estimated fair value
- Analyst price target for KLK is RM21.52 which is similar to our fair value estimate
Does the October share price for Kuala Lumpur Kepong Berhad (KLSE:KLK) reflect what it's really worth? Today, we will estimate the stock's intrinsic value by taking the expected future cash flows and discounting them to their present value. Our analysis will employ the Discounted Cash Flow (DCF) model. It may sound complicated, but actually it is quite simple!
Companies can be valued in a lot of ways, so we would point out that a DCF is not perfect for every situation. For those who are keen learners of equity analysis, the Simply Wall St analysis model here may be something of interest to you.
The Method
We use what is known as a 2-stage model, which simply means we have two different periods of growth rates for the company's cash flows. Generally the first stage is higher growth, and the second stage is a lower growth phase. To start off with, we need to estimate the next ten years of cash flows. Where possible we use analyst estimates, but when these aren't available we extrapolate the previous free cash flow (FCF) from the last estimate or reported value. We assume companies with shrinking free cash flow will slow their rate of shrinkage, and that companies with growing free cash flow will see their growth rate slow, over this period. We do this to reflect that growth tends to slow more in the early years than it does in later years.
Generally we assume that a dollar today is more valuable than a dollar in the future, so we discount the value of these future cash flows to their estimated value in today's dollars:
10-year free cash flow (FCF) estimate
| 2026 | 2027 | 2028 | 2029 | 2030 | 2031 | 2032 | 2033 | 2034 | 2035 | |
| Levered FCF (MYR, Millions) | RM861.2m | RM996.4m | RM1.10b | RM1.19b | RM1.28b | RM1.35b | RM1.43b | RM1.49b | RM1.56b | RM1.63b |
| Growth Rate Estimate Source | Analyst x3 | Analyst x3 | Est @ 10.48% | Est @ 8.44% | Est @ 7.01% | Est @ 6.01% | Est @ 5.31% | Est @ 4.81% | Est @ 4.47% | Est @ 4.23% |
| Present Value (MYR, Millions) Discounted @ 8.5% | RM794 | RM847 | RM863 | RM863 | RM851 | RM832 | RM808 | RM781 | RM752 | RM723 |
("Est" = FCF growth rate estimated by Simply Wall St)
Present Value of 10-year Cash Flow (PVCF) = RM8.1b
The second stage is also known as Terminal Value, this is the business's cash flow after the first stage. For a number of reasons a very conservative growth rate is used that cannot exceed that of a country's GDP growth. In this case we have used the 5-year average of the 10-year government bond yield (3.7%) to estimate future growth. In the same way as with the 10-year 'growth' period, we discount future cash flows to today's value, using a cost of equity of 8.5%.
Terminal Value (TV)= FCF2035 × (1 + g) ÷ (r – g) = RM1.6b× (1 + 3.7%) ÷ (8.5%– 3.7%) = RM35b
Present Value of Terminal Value (PVTV)= TV / (1 + r)10= RM35b÷ ( 1 + 8.5%)10= RM16b
The total value, or equity value, is then the sum of the present value of the future cash flows, which in this case is RM24b. The last step is to then divide the equity value by the number of shares outstanding. Compared to the current share price of RM20.3, the company appears about fair value at a 4.9% discount to where the stock price trades currently. Remember though, that this is just an approximate valuation, and like any complex formula - garbage in, garbage out.
Important Assumptions
The calculation above is very dependent on two assumptions. The first is the discount rate and the other is the cash flows. You don't have to agree with these inputs, I recommend redoing the calculations yourself and playing with them. The DCF also does not consider the possible cyclicality of an industry, or a company's future capital requirements, so it does not give a full picture of a company's potential performance. Given that we are looking at Kuala Lumpur Kepong Berhad as potential shareholders, the cost of equity is used as the discount rate, rather than the cost of capital (or weighted average cost of capital, WACC) which accounts for debt. In this calculation we've used 8.5%, which is based on a levered beta of 0.800. Beta is a measure of a stock's volatility, compared to the market as a whole. We get our beta from the industry average beta of globally comparable companies, with an imposed limit between 0.8 and 2.0, which is a reasonable range for a stable business.
See our latest analysis for Kuala Lumpur Kepong Berhad
SWOT Analysis for Kuala Lumpur Kepong Berhad
Strength
- Earnings growth over the past year exceeded its 5-year average.
- Debt is well covered by earnings.
Weakness
- Earnings growth over the past year underperformed the Food industry.
- Dividend is low compared to the top 25% of dividend payers in the Food market.
Opportunity
- Annual earnings are forecast to grow faster than the Malaysian market.
- Current share price is below our estimate of fair value.
Threat
- Debt is not well covered by operating cash flow.
- Dividends are not covered by earnings and cashflows.
- Annual revenue is forecast to grow slower than the Malaysian market.
Looking Ahead:
Valuation is only one side of the coin in terms of building your investment thesis, and it shouldn't be the only metric you look at when researching a company. The DCF model is not a perfect stock valuation tool. Instead the best use for a DCF model is to test certain assumptions and theories to see if they would lead to the company being undervalued or overvalued. If a company grows at a different rate, or if its cost of equity or risk free rate changes sharply, the output can look very different. For Kuala Lumpur Kepong Berhad, there are three pertinent aspects you should assess:
- Risks: We feel that you should assess the 2 warning signs for Kuala Lumpur Kepong Berhad we've flagged before making an investment in the company.
- Future Earnings: How does KLK's growth rate compare to its peers and the wider market? Dig deeper into the analyst consensus number for the upcoming years by interacting with our free analyst growth expectation chart.
- Other High Quality Alternatives: Do you like a good all-rounder? Explore our interactive list of high quality stocks to get an idea of what else is out there you may be missing!
PS. Simply Wall St updates its DCF calculation for every Malaysian stock every day, so if you want to find the intrinsic value of any other stock just search here.
Valuation is complex, but we're here to simplify it.
Discover if Kuala Lumpur Kepong Berhad might be undervalued or overvalued with our detailed analysis, featuring fair value estimates, potential risks, dividends, insider trades, and its financial condition.
Access Free AnalysisHave feedback on this article? Concerned about the content? Get in touch with us directly. Alternatively, email editorial-team (at) simplywallst.com.
This article by Simply Wall St is general in nature. We provide commentary based on historical data and analyst forecasts only using an unbiased methodology and our articles are not intended to be financial advice. It does not constitute a recommendation to buy or sell any stock, and does not take account of your objectives, or your financial situation. We aim to bring you long-term focused analysis driven by fundamental data. Note that our analysis may not factor in the latest price-sensitive company announcements or qualitative material. Simply Wall St has no position in any stocks mentioned.
About KLSE:KLK
Kuala Lumpur Kepong Berhad
Engages in the plantation, manufacturing, and property development businesses.
Mediocre balance sheet with limited growth.
Similar Companies
Market Insights

Advertisement
Community Narratives
The Next Phase of Energy Storage: How NeoVolta Is Tackling America’s Power Crunch
Fair Value US$7.50|23.7% undervalued
MA
Community Contributor
A formidable player in AI and enterprise computing.
Fair Value US$210.00|0.7% overvalued
CO
Community Contributor
IREN's Bold Moves in Sustainable Bitcoin Mining & AI Data Centers
Fair Value US$72.52|14.9% undervalued
BL
Community Contributor
Cooling the Champions: The Aussie Tech Behind F1's Victories
Fair Value AU$12.40|38.1% undervalued
TR
Community Contributor