

Warren Buffett famously said, 'Volatility is far from synonymous with risk.' So it seems the smart money knows that debt - which is usually involved in bankruptcies - is a very important factor, when you assess how risky a company is. As with many other companies Astral Asia Berhad (KLSE:AASIA) makes use of debt. But should shareholders be worried about its use of debt?
When Is Debt Dangerous?
Debt is a tool to help businesses grow, but if a business is incapable of paying off its lenders, then it exists at their mercy. If things get really bad, the lenders can take control of the business. However, a more frequent (but still costly) occurrence is where a company must issue shares at bargain-basement prices, permanently diluting shareholders, just to shore up its balance sheet. Of course, plenty of companies use debt to fund growth, without any negative consequences. When we think about a company's use of debt, we first look at cash and debt together.
Check out our latest analysis for Astral Asia Berhad
What Is Astral Asia Berhad's Net Debt?
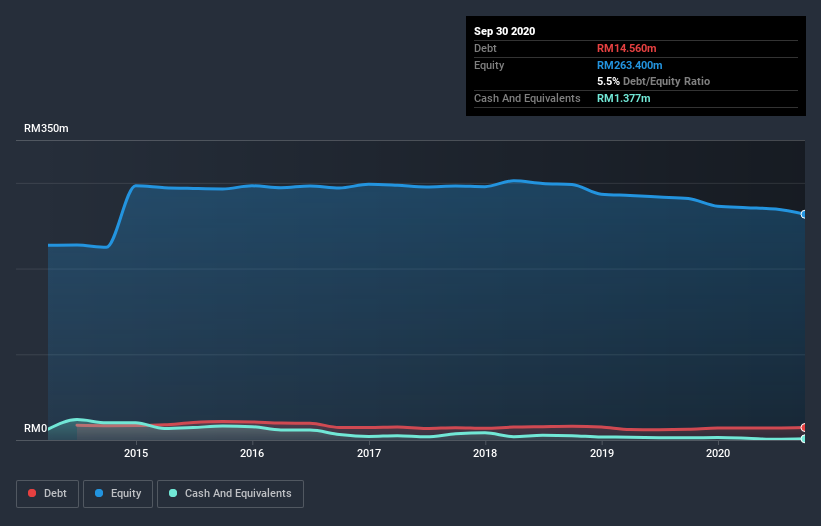
You can click the graphic below for the historical numbers, but it shows that as of September 2020 Astral Asia Berhad had RM14.6m of debt, an increase on RM12.6m, over one year. However, it also had RM1.38m in cash, and so its net debt is RM13.2m.
How Strong Is Astral Asia Berhad's Balance Sheet?
The latest balance sheet data shows that Astral Asia Berhad had liabilities of RM14.8m due within a year, and liabilities of RM93.2m falling due after that. Offsetting these obligations, it had cash of RM1.38m as well as receivables valued at RM2.80m due within 12 months. So it has liabilities totalling RM103.8m more than its cash and near-term receivables, combined.
Given this deficit is actually higher than the company's market capitalization of RM85.8m, we think shareholders really should watch Astral Asia Berhad's debt levels, like a parent watching their child ride a bike for the first time. In the scenario where the company had to clean up its balance sheet quickly, it seems likely shareholders would suffer extensive dilution. The balance sheet is clearly the area to focus on when you are analysing debt. But you can't view debt in total isolation; since Astral Asia Berhad will need earnings to service that debt. So if you're keen to discover more about its earnings, it might be worth checking out this graph of its long term earnings trend.
In the last year Astral Asia Berhad had a loss before interest and tax, and actually shrunk its revenue by 16%, to RM16m. We would much prefer see growth.
Caveat Emptor
Not only did Astral Asia Berhad's revenue slip over the last twelve months, but it also produced negative earnings before interest and tax (EBIT). Its EBIT loss was a whopping RM9.1m. Considering that alongside the liabilities mentioned above make us nervous about the company. We'd want to see some strong near-term improvements before getting too interested in the stock. Not least because it burned through RM731k in negative free cash flow over the last year. So suffice it to say we consider the stock to be risky. The balance sheet is clearly the area to focus on when you are analysing debt. However, not all investment risk resides within the balance sheet - far from it. Case in point: We've spotted 3 warning signs for Astral Asia Berhad you should be aware of, and 1 of them makes us a bit uncomfortable.
At the end of the day, it's often better to focus on companies that are free from net debt. You can access our special list of such companies (all with a track record of profit growth). It's free.
If you decide to trade Astral Asia Berhad, use the lowest-cost* platform that is rated #1 Overall by Barron’s, Interactive Brokers. Trade stocks, options, futures, forex, bonds and funds on 135 markets, all from a single integrated account. Promoted
If you're looking to trade Astral Asia Berhad, open an account with the lowest-cost platform trusted by professionals, Interactive Brokers.
With clients in over 200 countries and territories, and access to 160 markets, IBKR lets you trade stocks, options, futures, forex, bonds and funds from a single integrated account.
Enjoy no hidden fees, no account minimums, and FX conversion rates as low as 0.03%, far better than what most brokers offer.
Sponsored ContentNew: Manage All Your Stock Portfolios in One Place
We've created the ultimate portfolio companion for stock investors, and it's free.
• Connect an unlimited number of Portfolios and see your total in one currency
• Be alerted to new Warning Signs or Risks via email or mobile
• Track the Fair Value of your stocks
This article by Simply Wall St is general in nature. It does not constitute a recommendation to buy or sell any stock, and does not take account of your objectives, or your financial situation. We aim to bring you long-term focused analysis driven by fundamental data. Note that our analysis may not factor in the latest price-sensitive company announcements or qualitative material. Simply Wall St has no position in any stocks mentioned.
*Interactive Brokers Rated Lowest Cost Broker by StockBrokers.com Annual Online Review 2020
Have feedback on this article? Concerned about the content? Get in touch with us directly. Alternatively, email editorial-team (at) simplywallst.com.
About KLSE:AASIA
Astral Asia Berhad
An investment holding company, engages in the cultivation of oil palm in Malaysia.
Low with imperfect balance sheet.
Market Insights

Community Narratives


