- Malaysia
- /
- Energy Services
- /
- KLSE:SAPNRG
Is Sapura Energy Berhad (KLSE:SAPNRG) Trading At A 31% Discount?


Key Insights
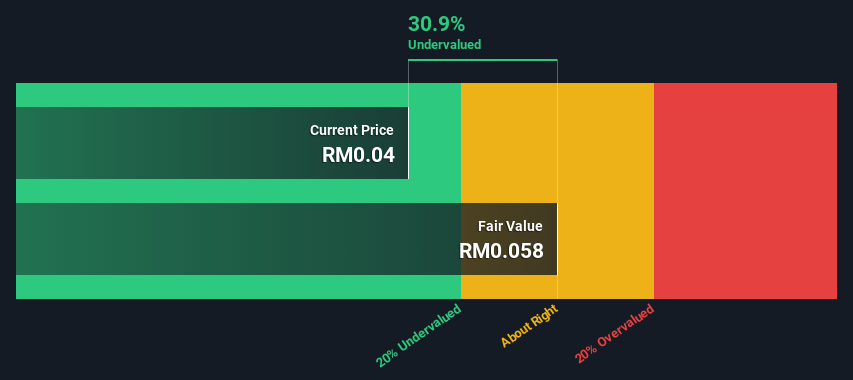
- Sapura Energy Berhad's estimated fair value is RM0.058 based on 2 Stage Free Cash Flow to Equity
- Sapura Energy Berhad is estimated to be 31% undervalued based on current share price of RM0.04
- The average premium for Sapura Energy Berhad's competitorsis currently 281%
How far off is Sapura Energy Berhad (KLSE:SAPNRG) from its intrinsic value? Using the most recent financial data, we'll take a look at whether the stock is fairly priced by estimating the company's future cash flows and discounting them to their present value. This will be done using the Discounted Cash Flow (DCF) model. It may sound complicated, but actually it is quite simple!
Companies can be valued in a lot of ways, so we would point out that a DCF is not perfect for every situation. If you want to learn more about discounted cash flow, the rationale behind this calculation can be read in detail in the Simply Wall St analysis model.
View our latest analysis for Sapura Energy Berhad
What's The Estimated Valuation?
We're using the 2-stage growth model, which simply means we take in account two stages of company's growth. In the initial period the company may have a higher growth rate and the second stage is usually assumed to have a stable growth rate. To begin with, we have to get estimates of the next ten years of cash flows. Seeing as no analyst estimates of free cash flow are available to us, we have extrapolate the previous free cash flow (FCF) from the company's last reported value. We assume companies with shrinking free cash flow will slow their rate of shrinkage, and that companies with growing free cash flow will see their growth rate slow, over this period. We do this to reflect that growth tends to slow more in the early years than it does in later years.
Generally we assume that a dollar today is more valuable than a dollar in the future, so we discount the value of these future cash flows to their estimated value in today's dollars:
10-year free cash flow (FCF) forecast
| 2025 | 2026 | 2027 | 2028 | 2029 | 2030 | 2031 | 2032 | 2033 | 2034 | |
| Levered FCF (MYR, Millions) | RM157.4m | RM144.1m | RM137.2m | RM134.0m | RM133.3m | RM134.2m | RM136.2m | RM139.1m | RM142.7m | RM146.8m |
| Growth Rate Estimate Source | Est @ -13.56% | Est @ -8.43% | Est @ -4.83% | Est @ -2.32% | Est @ -0.56% | Est @ 0.67% | Est @ 1.54% | Est @ 2.14% | Est @ 2.56% | Est @ 2.86% |
| Present Value (MYR, Millions) Discounted @ 15% | RM137 | RM110 | RM90.9 | RM77.4 | RM67.1 | RM58.9 | RM52.1 | RM46.4 | RM41.5 | RM37.2 |
("Est" = FCF growth rate estimated by Simply Wall St)
Present Value of 10-year Cash Flow (PVCF) = RM718m
The second stage is also known as Terminal Value, this is the business's cash flow after the first stage. The Gordon Growth formula is used to calculate Terminal Value at a future annual growth rate equal to the 5-year average of the 10-year government bond yield of 3.6%. We discount the terminal cash flows to today's value at a cost of equity of 15%.
Terminal Value (TV)= FCF2034 × (1 + g) ÷ (r – g) = RM147m× (1 + 3.6%) ÷ (15%– 3.6%) = RM1.4b
Present Value of Terminal Value (PVTV)= TV / (1 + r)10= RM1.4b÷ ( 1 + 15%)10= RM345m
The total value, or equity value, is then the sum of the present value of the future cash flows, which in this case is RM1.1b. In the final step we divide the equity value by the number of shares outstanding. Relative to the current share price of RM0.04, the company appears quite undervalued at a 31% discount to where the stock price trades currently. The assumptions in any calculation have a big impact on the valuation, so it is better to view this as a rough estimate, not precise down to the last cent.
The Assumptions
Now the most important inputs to a discounted cash flow are the discount rate, and of course, the actual cash flows. If you don't agree with these result, have a go at the calculation yourself and play with the assumptions. The DCF also does not consider the possible cyclicality of an industry, or a company's future capital requirements, so it does not give a full picture of a company's potential performance. Given that we are looking at Sapura Energy Berhad as potential shareholders, the cost of equity is used as the discount rate, rather than the cost of capital (or weighted average cost of capital, WACC) which accounts for debt. In this calculation we've used 15%, which is based on a levered beta of 2.000. Beta is a measure of a stock's volatility, compared to the market as a whole. We get our beta from the industry average beta of globally comparable companies, with an imposed limit between 0.8 and 2.0, which is a reasonable range for a stable business.
SWOT Analysis for Sapura Energy Berhad
- No major strengths identified for SAPNRG.
- Shareholders have been diluted in the past year.
- Forecast to reduce losses next year.
- Has sufficient cash runway for more than 3 years based on current free cash flows.
- Good value based on P/S ratio and estimated fair value.
- Debt is not well covered by operating cash flow.
- Total liabilities exceed total assets, which raises the risk of financial distress.
Looking Ahead:
Whilst important, the DCF calculation is only one of many factors that you need to assess for a company. The DCF model is not a perfect stock valuation tool. Preferably you'd apply different cases and assumptions and see how they would impact the company's valuation. If a company grows at a different rate, or if its cost of equity or risk free rate changes sharply, the output can look very different. Why is the intrinsic value higher than the current share price? For Sapura Energy Berhad, we've put together three essential items you should further research:
- Risks: Take risks, for example - Sapura Energy Berhad has 4 warning signs (and 2 which can't be ignored) we think you should know about.
- Future Earnings: How does SAPNRG's growth rate compare to its peers and the wider market? Dig deeper into the analyst consensus number for the upcoming years by interacting with our free analyst growth expectation chart.
- Other High Quality Alternatives: Do you like a good all-rounder? Explore our interactive list of high quality stocks to get an idea of what else is out there you may be missing!
PS. Simply Wall St updates its DCF calculation for every Malaysian stock every day, so if you want to find the intrinsic value of any other stock just search here.
If you're looking to trade Sapura Energy Berhad, open an account with the lowest-cost platform trusted by professionals, Interactive Brokers.
With clients in over 200 countries and territories, and access to 160 markets, IBKR lets you trade stocks, options, futures, forex, bonds and funds from a single integrated account.
Enjoy no hidden fees, no account minimums, and FX conversion rates as low as 0.03%, far better than what most brokers offer.
Sponsored ContentNew: Manage All Your Stock Portfolios in One Place
We've created the ultimate portfolio companion for stock investors, and it's free.
• Connect an unlimited number of Portfolios and see your total in one currency
• Be alerted to new Warning Signs or Risks via email or mobile
• Track the Fair Value of your stocks
Have feedback on this article? Concerned about the content? Get in touch with us directly. Alternatively, email editorial-team (at) simplywallst.com.
This article by Simply Wall St is general in nature. We provide commentary based on historical data and analyst forecasts only using an unbiased methodology and our articles are not intended to be financial advice. It does not constitute a recommendation to buy or sell any stock, and does not take account of your objectives, or your financial situation. We aim to bring you long-term focused analysis driven by fundamental data. Note that our analysis may not factor in the latest price-sensitive company announcements or qualitative material. Simply Wall St has no position in any stocks mentioned.
About KLSE:SAPNRG
Sapura Energy Berhad
An investment holding company, offers integrated energy services and solutions in Malaysia, Australia, Africa, the Americas, the Middle East, Asia, and internationally.
Fair value with moderate growth potential.

