- Malaysia
- /
- Oil and Gas
- /
- KLSE:PETRONM
Update: Petron Malaysia Refining & Marketing Bhd (KLSE:PETRONM) Stock Gained 89% In The Last Year

Passive investing in index funds can generate returns that roughly match the overall market. But investors can boost returns by picking market-beating companies to own shares in. For example, the Petron Malaysia Refining & Marketing Bhd (KLSE:PETRONM) share price is up 89% in the last year, clearly besting the market return of around 41% (not including dividends). That's a solid performance by our standards! On the other hand, longer term shareholders have had a tougher run, with the stock falling 50% in three years.
View our latest analysis for Petron Malaysia Refining & Marketing Bhd
While markets are a powerful pricing mechanism, share prices reflect investor sentiment, not just underlying business performance. One way to examine how market sentiment has changed over time is to look at the interaction between a company's share price and its earnings per share (EPS).
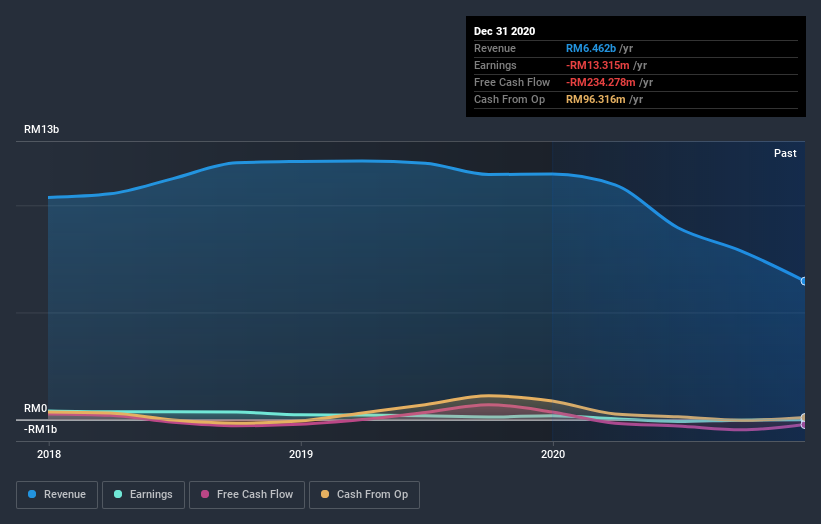
Over the last twelve months Petron Malaysia Refining & Marketing Bhd went from profitable to unprofitable. While this may prove temporary, we'd consider it a negative, so we would not have expected to see the share price up. We might get a clue to explain the share price move by looking to other metrics.
Petron Malaysia Refining & Marketing Bhd's revenue actually dropped 44% over last year. So the fundamental metrics don't provide an obvious explanation for the share price gain.
You can see below how earnings and revenue have changed over time (discover the exact values by clicking on the image).
Balance sheet strength is crucial. It might be well worthwhile taking a look at our free report on how its financial position has changed over time.
What About Dividends?
As well as measuring the share price return, investors should also consider the total shareholder return (TSR). Whereas the share price return only reflects the change in the share price, the TSR includes the value of dividends (assuming they were reinvested) and the benefit of any discounted capital raising or spin-off. It's fair to say that the TSR gives a more complete picture for stocks that pay a dividend. In the case of Petron Malaysia Refining & Marketing Bhd, it has a TSR of 94% for the last year. That exceeds its share price return that we previously mentioned. This is largely a result of its dividend payments!
A Different Perspective
It's nice to see that Petron Malaysia Refining & Marketing Bhd shareholders have received a total shareholder return of 94% over the last year. And that does include the dividend. That certainly beats the loss of about 0.8% per year over the last half decade. This makes us a little wary, but the business might have turned around its fortunes. It's always interesting to track share price performance over the longer term. But to understand Petron Malaysia Refining & Marketing Bhd better, we need to consider many other factors. To that end, you should learn about the 3 warning signs we've spotted with Petron Malaysia Refining & Marketing Bhd (including 1 which shouldn't be ignored) .
But note: Petron Malaysia Refining & Marketing Bhd may not be the best stock to buy. So take a peek at this free list of interesting companies with past earnings growth (and further growth forecast).
Please note, the market returns quoted in this article reflect the market weighted average returns of stocks that currently trade on MY exchanges.
If you decide to trade Petron Malaysia Refining & Marketing Bhd, use the lowest-cost* platform that is rated #1 Overall by Barron’s, Interactive Brokers. Trade stocks, options, futures, forex, bonds and funds on 135 markets, all from a single integrated account. Promoted
New: Manage All Your Stock Portfolios in One Place
We've created the ultimate portfolio companion for stock investors, and it's free.
• Connect an unlimited number of Portfolios and see your total in one currency
• Be alerted to new Warning Signs or Risks via email or mobile
• Track the Fair Value of your stocks
This article by Simply Wall St is general in nature. It does not constitute a recommendation to buy or sell any stock, and does not take account of your objectives, or your financial situation. We aim to bring you long-term focused analysis driven by fundamental data. Note that our analysis may not factor in the latest price-sensitive company announcements or qualitative material. Simply Wall St has no position in any stocks mentioned.
*Interactive Brokers Rated Lowest Cost Broker by StockBrokers.com Annual Online Review 2020
Have feedback on this article? Concerned about the content? Get in touch with us directly. Alternatively, email editorial-team (at) simplywallst.com.
About KLSE:PETRONM
Petron Malaysia Refining & Marketing Bhd
Engages in manufacturing and marketing of petroleum products in Peninsular Malaysia.
Moderate growth potential low.

