- Malaysia
- /
- Hospitality
- /
- KLSE:ICONIC
Optimistic Investors Push Iconic Worldwide Berhad (KLSE:ICONIC) Shares Up 30% But Growth Is Lacking


Iconic Worldwide Berhad (KLSE:ICONIC) shares have had a really impressive month, gaining 30% after a shaky period beforehand. Unfortunately, despite the strong performance over the last month, the full year gain of 8.3% isn't as attractive.
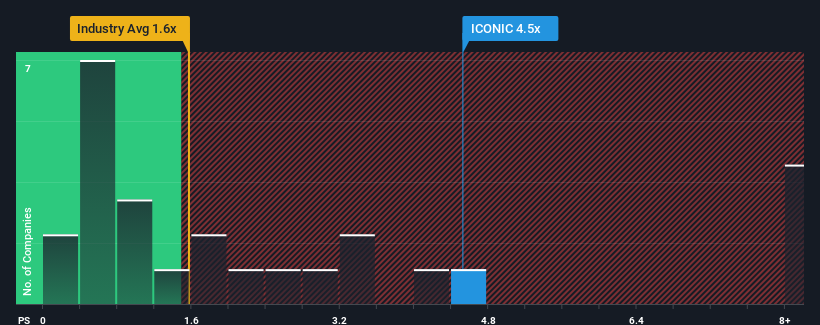
After such a large jump in price, you could be forgiven for thinking Iconic Worldwide Berhad is a stock to steer clear of with a price-to-sales ratios (or "P/S") of 4.5x, considering almost half the companies in Malaysia's Hospitality industry have P/S ratios below 1.6x. Nonetheless, we'd need to dig a little deeper to determine if there is a rational basis for the highly elevated P/S.
Check out our latest analysis for Iconic Worldwide Berhad
What Does Iconic Worldwide Berhad's P/S Mean For Shareholders?
For example, consider that Iconic Worldwide Berhad's financial performance has been poor lately as its revenue has been in decline. It might be that many expect the company to still outplay most other companies over the coming period, which has kept the P/S from collapsing. However, if this isn't the case, investors might get caught out paying too much for the stock.
We don't have analyst forecasts, but you can see how recent trends are setting up the company for the future by checking out our free report on Iconic Worldwide Berhad's earnings, revenue and cash flow.Is There Enough Revenue Growth Forecasted For Iconic Worldwide Berhad?
In order to justify its P/S ratio, Iconic Worldwide Berhad would need to produce outstanding growth that's well in excess of the industry.
In reviewing the last year of financials, we were disheartened to see the company's revenues fell to the tune of 60%. Regardless, revenue has managed to lift by a handy 9.4% in aggregate from three years ago, thanks to the earlier period of growth. Although it's been a bumpy ride, it's still fair to say the revenue growth recently has been mostly respectable for the company.
Comparing that to the industry, which is predicted to deliver 4.3% growth in the next 12 months, the company's momentum is pretty similar based on recent medium-term annualised revenue results.
With this information, we find it interesting that Iconic Worldwide Berhad is trading at a high P/S compared to the industry. It seems most investors are ignoring the fairly average recent growth rates and are willing to pay up for exposure to the stock. Nevertheless, they may be setting themselves up for future disappointment if the P/S falls to levels more in line with recent growth rates.
The Key Takeaway
Iconic Worldwide Berhad's P/S has grown nicely over the last month thanks to a handy boost in the share price. Using the price-to-sales ratio alone to determine if you should sell your stock isn't sensible, however it can be a practical guide to the company's future prospects.
We didn't expect to see Iconic Worldwide Berhad trade at such a high P/S considering its last three-year revenue growth has only been on par with the rest of the industry. When we see average revenue with industry-like growth combined with a high P/S, we suspect the share price is at risk of declining, bringing the P/S back in line with the industry too. Unless the recent medium-term conditions improve, it's challenging to accept these prices as being reasonable.
You should always think about risks. Case in point, we've spotted 4 warning signs for Iconic Worldwide Berhad you should be aware of, and 3 of them shouldn't be ignored.
If companies with solid past earnings growth is up your alley, you may wish to see this free collection of other companies with strong earnings growth and low P/E ratios.
If you're looking to trade Iconic Worldwide Berhad, open an account with the lowest-cost platform trusted by professionals, Interactive Brokers.
With clients in over 200 countries and territories, and access to 160 markets, IBKR lets you trade stocks, options, futures, forex, bonds and funds from a single integrated account.
Enjoy no hidden fees, no account minimums, and FX conversion rates as low as 0.03%, far better than what most brokers offer.
Sponsored ContentNew: AI Stock Screener & Alerts
Our new AI Stock Screener scans the market every day to uncover opportunities.
• Dividend Powerhouses (3%+ Yield)
• Undervalued Small Caps with Insider Buying
• High growth Tech and AI Companies
Or build your own from over 50 metrics.
Have feedback on this article? Concerned about the content? Get in touch with us directly. Alternatively, email editorial-team (at) simplywallst.com.
This article by Simply Wall St is general in nature. We provide commentary based on historical data and analyst forecasts only using an unbiased methodology and our articles are not intended to be financial advice. It does not constitute a recommendation to buy or sell any stock, and does not take account of your objectives, or your financial situation. We aim to bring you long-term focused analysis driven by fundamental data. Note that our analysis may not factor in the latest price-sensitive company announcements or qualitative material. Simply Wall St has no position in any stocks mentioned.
About KLSE:ICONIC
Iconic Worldwide Berhad
An investment holding company, engages in tourism and property businesses in Malaysia, Turkey, Australia, Hong Kong, Thailand, Philippines, and the Middle East.
Low with imperfect balance sheet.
Market Insights

Community Narratives

