
Advertisement
- Malaysia
- /
- Food and Staples Retail
- /
- KLSE:KTC
Kim Teck Cheong Consolidated Berhad (KLSE:KTC) May Have Issues Allocating Its Capital
There are a few key trends to look for if we want to identify the next multi-bagger. Ideally, a business will show two trends; firstly a growing return on capital employed (ROCE) and secondly, an increasing amount of capital employed. This shows us that it's a compounding machine, able to continually reinvest its earnings back into the business and generate higher returns. However, after briefly looking over the numbers, we don't think Kim Teck Cheong Consolidated Berhad (KLSE:KTC) has the makings of a multi-bagger going forward, but let's have a look at why that may be.
Our free stock report includes 3 warning signs investors should be aware of before investing in Kim Teck Cheong Consolidated Berhad. Read for free now.What Is Return On Capital Employed (ROCE)?
If you haven't worked with ROCE before, it measures the 'return' (pre-tax profit) a company generates from capital employed in its business. Analysts use this formula to calculate it for Kim Teck Cheong Consolidated Berhad:
Return on Capital Employed = Earnings Before Interest and Tax (EBIT) ÷ (Total Assets - Current Liabilities)
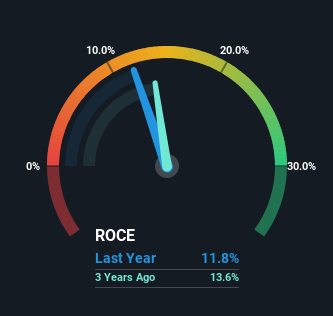
0.12 = RM30m ÷ (RM475m - RM221m) (Based on the trailing twelve months to December 2024).
Therefore, Kim Teck Cheong Consolidated Berhad has an ROCE of 12%. That's a relatively normal return on capital, and it's around the 13% generated by the Consumer Retailing industry.
Check out our latest analysis for Kim Teck Cheong Consolidated Berhad
While the past is not representative of the future, it can be helpful to know how a company has performed historically, which is why we have this chart above. If you want to delve into the historical earnings , check out these free graphs detailing revenue and cash flow performance of Kim Teck Cheong Consolidated Berhad.
How Are Returns Trending?
In terms of Kim Teck Cheong Consolidated Berhad's historical ROCE movements, the trend isn't fantastic. Around five years ago the returns on capital were 16%, but since then they've fallen to 12%. However, given capital employed and revenue have both increased it appears that the business is currently pursuing growth, at the consequence of short term returns. If these investments prove successful, this can bode very well for long term stock performance.
On a related note, Kim Teck Cheong Consolidated Berhad has decreased its current liabilities to 47% of total assets. That could partly explain why the ROCE has dropped. What's more, this can reduce some aspects of risk to the business because now the company's suppliers or short-term creditors are funding less of its operations. Since the business is basically funding more of its operations with it's own money, you could argue this has made the business less efficient at generating ROCE. Keep in mind 47% is still pretty high, so those risks are still somewhat prevalent.
What We Can Learn From Kim Teck Cheong Consolidated Berhad's ROCE
In summary, despite lower returns in the short term, we're encouraged to see that Kim Teck Cheong Consolidated Berhad is reinvesting for growth and has higher sales as a result. However, despite the promising trends, the stock has fallen 17% over the last five years, so there might be an opportunity here for astute investors. So we think it'd be worthwhile to look further into this stock given the trends look encouraging.
Kim Teck Cheong Consolidated Berhad does have some risks, we noticed 3 warning signs (and 1 which can't be ignored) we think you should know about.
While Kim Teck Cheong Consolidated Berhad may not currently earn the highest returns, we've compiled a list of companies that currently earn more than 25% return on equity. Check out this free list here.
Valuation is complex, but we're here to simplify it.
Discover if Kim Teck Cheong Consolidated Berhad might be undervalued or overvalued with our detailed analysis, featuring fair value estimates, potential risks, dividends, insider trades, and its financial condition.
Access Free AnalysisHave feedback on this article? Concerned about the content? Get in touch with us directly. Alternatively, email editorial-team (at) simplywallst.com.
This article by Simply Wall St is general in nature. We provide commentary based on historical data and analyst forecasts only using an unbiased methodology and our articles are not intended to be financial advice. It does not constitute a recommendation to buy or sell any stock, and does not take account of your objectives, or your financial situation. We aim to bring you long-term focused analysis driven by fundamental data. Note that our analysis may not factor in the latest price-sensitive company announcements or qualitative material. Simply Wall St has no position in any stocks mentioned.
About KLSE:KTC
Kim Teck Cheong Consolidated Berhad
Engages in distribution and warehousing of consumer packaged goods in East Malaysia and Brunei.
Adequate balance sheet and slightly overvalued.
Market Insights

Advertisement
Weekly Picks
WO

woodworthfund on MGP Ingredients ·
THE KINGDOM OF BROWN GOODS: WHY MGPI IS BEING CRUSHED BY INVENTORY & PRIMED FOR RESURRECTION
Fair Value:US$4039.0% undervalued
6 followersusers have followed this narrative
0 commentsusers have commented on this narrative
3 likesusers have liked this narrative
DO


Double_Bubbler on Vertical Aerospace ·
Why Vertical Aerospace (NYSE: EVTL) is Worth Possibly Over 13x its Current Price
Fair Value:US$6087.9% undervalued
8 followersusers have followed this narrative
1 commentusers have commented on this narrative
9 likesusers have liked this narrative
TI


TickerTickle on Oracle ·
The Quiet Giant That Became AI’s Power Grid
Fair Value:US$389.8143.2% undervalued
23 followersusers have followed this narrative
1 commentusers have commented on this narrative
5 likesusers have liked this narrative
Recently Updated Narratives
OP

OpenHorizons on Channel Vas Investments ·
Growing between 25-50% for the next 3-5 years
Fair Value:R12.1161.5% overvalued
1 followerusers have followed this narrative
0 commentsusers have commented on this narrative
0 likesusers have liked this narrative
NO

Norms70 on Standard Lithium ·
SLI is share to watch next 5 years
Fair Value:€4.57.6% undervalued
4 followersusers have followed this narrative
0 commentsusers have commented on this narrative
0 likesusers have liked this narrative
DA


davidlsander on Beam Therapeutics ·
The "Molecular Pencil": Why Beam's Technology is Built to Win
Fair Value:US$15082.3% undervalued
62 followersusers have followed this narrative
3 commentsusers have commented on this narrative
0 likesusers have liked this narrative
Popular Narratives
TH


TheWallstreetKing on MicroVision ·
MicroVision will explode future revenue by 380.37% with a vision towards success
Fair Value:US$6098.4% undervalued
118 followersusers have followed this narrative
11 commentsusers have commented on this narrative
22 likesusers have liked this narrative
AN


AnalystConsensusTarget on NVIDIA ·
NVDA: Expanding AI Demand Will Drive Major Data Center Investments Through 2026
Fair Value:US$250.3926.1% undervalued
962 followersusers have followed this narrative
6 commentsusers have commented on this narrative
25 likesusers have liked this narrative
RO


RockeTeller on Santacruz Silver Mining ·
Crazy Undervalued 42 Baggers Silver Play (Active & Running Mine)
Fair Value:CA$8696.4% undervalued
75 followersusers have followed this narrative
7 commentsusers have commented on this narrative
21 likesusers have liked this narrative
