
Advertisement
- Malaysia
- /
- Professional Services
- /
- KLSE:RAMSSOL
Are Investors Undervaluing Ramssol Group Berhad (KLSE:RAMSSOL) By 40%?

Key Insights
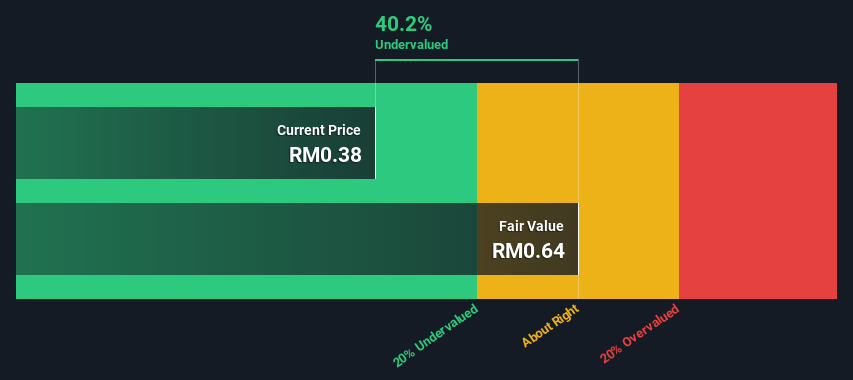
- The projected fair value for Ramssol Group Berhad is RM0.64 based on 2 Stage Free Cash Flow to Equity
- Current share price of RM0.38 suggests Ramssol Group Berhad is potentially 40% undervalued
Does the February share price for Ramssol Group Berhad (KLSE:RAMSSOL) reflect what it's really worth? Today, we will estimate the stock's intrinsic value by estimating the company's future cash flows and discounting them to their present value. We will take advantage of the Discounted Cash Flow (DCF) model for this purpose. Believe it or not, it's not too difficult to follow, as you'll see from our example!
Remember though, that there are many ways to estimate a company's value, and a DCF is just one method. Anyone interested in learning a bit more about intrinsic value should have a read of the Simply Wall St analysis model.
Check out our latest analysis for Ramssol Group Berhad
Step By Step Through The Calculation
We are going to use a two-stage DCF model, which, as the name states, takes into account two stages of growth. The first stage is generally a higher growth period which levels off heading towards the terminal value, captured in the second 'steady growth' period. To start off with, we need to estimate the next ten years of cash flows. Where possible we use analyst estimates, but when these aren't available we extrapolate the previous free cash flow (FCF) from the last estimate or reported value. We assume companies with shrinking free cash flow will slow their rate of shrinkage, and that companies with growing free cash flow will see their growth rate slow, over this period. We do this to reflect that growth tends to slow more in the early years than it does in later years.
A DCF is all about the idea that a dollar in the future is less valuable than a dollar today, so we discount the value of these future cash flows to their estimated value in today's dollars:
10-year free cash flow (FCF) estimate
| 2023 | 2024 | 2025 | 2026 | 2027 | 2028 | 2029 | 2030 | 2031 | 2032 | |
| Levered FCF (MYR, Millions) | RM2.76m | RM5.09m | RM7.08m | RM9.09m | RM11.0m | RM12.7m | RM14.3m | RM15.6m | RM16.9m | RM18.0m |
| Growth Rate Estimate Source | Analyst x2 | Analyst x2 | Est @ 39.16% | Est @ 28.48% | Est @ 21.01% | Est @ 15.78% | Est @ 12.12% | Est @ 9.55% | Est @ 7.76% | Est @ 6.50% |
| Present Value (MYR, Millions) Discounted @ 11% | RM2.5 | RM4.2 | RM5.2 | RM6.1 | RM6.6 | RM7.0 | RM7.1 | RM7.0 | RM6.8 | RM6.6 |
("Est" = FCF growth rate estimated by Simply Wall St)
Present Value of 10-year Cash Flow (PVCF) = RM59m
The second stage is also known as Terminal Value, this is the business's cash flow after the first stage. For a number of reasons a very conservative growth rate is used that cannot exceed that of a country's GDP growth. In this case we have used the 5-year average of the 10-year government bond yield (3.6%) to estimate future growth. In the same way as with the 10-year 'growth' period, we discount future cash flows to today's value, using a cost of equity of 11%.
Terminal Value (TV)= FCF2032 × (1 + g) ÷ (r – g) = RM18m× (1 + 3.6%) ÷ (11%– 3.6%) = RM264m
Present Value of Terminal Value (PVTV)= TV / (1 + r)10= RM264m÷ ( 1 + 11%)10= RM96m
The total value, or equity value, is then the sum of the present value of the future cash flows, which in this case is RM155m. To get the intrinsic value per share, we divide this by the total number of shares outstanding. Compared to the current share price of RM0.4, the company appears quite good value at a 40% discount to where the stock price trades currently. The assumptions in any calculation have a big impact on the valuation, so it is better to view this as a rough estimate, not precise down to the last cent.
The Assumptions
We would point out that the most important inputs to a discounted cash flow are the discount rate and of course the actual cash flows. You don't have to agree with these inputs, I recommend redoing the calculations yourself and playing with them. The DCF also does not consider the possible cyclicality of an industry, or a company's future capital requirements, so it does not give a full picture of a company's potential performance. Given that we are looking at Ramssol Group Berhad as potential shareholders, the cost of equity is used as the discount rate, rather than the cost of capital (or weighted average cost of capital, WACC) which accounts for debt. In this calculation we've used 11%, which is based on a levered beta of 0.879. Beta is a measure of a stock's volatility, compared to the market as a whole. We get our beta from the industry average beta of globally comparable companies, with an imposed limit between 0.8 and 2.0, which is a reasonable range for a stable business.
SWOT Analysis for Ramssol Group Berhad
Strength
- Debt is well covered by earnings.
Weakness
- Earnings declined over the past year.
- Shareholders have been diluted in the past year.
Opportunity
- Annual earnings are forecast to grow faster than the Malaysian market.
- Trading below our estimate of fair value by more than 20%.
Threat
- Debt is not well covered by operating cash flow.
Looking Ahead:
Whilst important, the DCF calculation shouldn't be the only metric you look at when researching a company. It's not possible to obtain a foolproof valuation with a DCF model. Instead the best use for a DCF model is to test certain assumptions and theories to see if they would lead to the company being undervalued or overvalued. If a company grows at a different rate, or if its cost of equity or risk free rate changes sharply, the output can look very different. Can we work out why the company is trading at a discount to intrinsic value? For Ramssol Group Berhad, we've compiled three relevant elements you should explore:
- Risks: For example, we've discovered 4 warning signs for Ramssol Group Berhad (1 is a bit concerning!) that you should be aware of before investing here.
- Future Earnings: How does RAMSSOL's growth rate compare to its peers and the wider market? Dig deeper into the analyst consensus number for the upcoming years by interacting with our free analyst growth expectation chart.
- Other High Quality Alternatives: Do you like a good all-rounder? Explore our interactive list of high quality stocks to get an idea of what else is out there you may be missing!
PS. Simply Wall St updates its DCF calculation for every Malaysian stock every day, so if you want to find the intrinsic value of any other stock just search here.
New: AI Stock Screener & Alerts
Our new AI Stock Screener scans the market every day to uncover opportunities.
• Dividend Powerhouses (3%+ Yield)
• Undervalued Small Caps with Insider Buying
• High growth Tech and AI Companies
Or build your own from over 50 metrics.
Have feedback on this article? Concerned about the content? Get in touch with us directly. Alternatively, email editorial-team (at) simplywallst.com.
This article by Simply Wall St is general in nature. We provide commentary based on historical data and analyst forecasts only using an unbiased methodology and our articles are not intended to be financial advice. It does not constitute a recommendation to buy or sell any stock, and does not take account of your objectives, or your financial situation. We aim to bring you long-term focused analysis driven by fundamental data. Note that our analysis may not factor in the latest price-sensitive company announcements or qualitative material. Simply Wall St has no position in any stocks mentioned.
About KLSE:RAMSSOL
Ramssol Group Berhad
An investment holding company, provides human resource solutions in Malaysia, Singapore, Thailand, Indonesia, the Netherlands, Hong Kong, and Japan.
Flawless balance sheet with solid track record.
Similar Companies
Market Insights

Advertisement
Community Narratives

BMW cruising ahead with new EVs and premium models to boost revenue 5%
Fair Value €135.07|44.6% undervalued
UN
Community Contributor
EU#2 - From Humble Beginnings to Global Powerhouse
Fair Value DKK 851.04|46.4% undervalued
TO
Community Contributor