- Malaysia
- /
- Construction
- /
- KLSE:TRC
Here's What's Concerning About TRC Synergy Berhad's (KLSE:TRC) Returns On Capital


If you're looking for a multi-bagger, there's a few things to keep an eye out for. Firstly, we'd want to identify a growing return on capital employed (ROCE) and then alongside that, an ever-increasing base of capital employed. Put simply, these types of businesses are compounding machines, meaning they are continually reinvesting their earnings at ever-higher rates of return. Although, when we looked at TRC Synergy Berhad (KLSE:TRC), it didn't seem to tick all of these boxes.
What Is Return On Capital Employed (ROCE)?
For those who don't know, ROCE is a measure of a company's yearly pre-tax profit (its return), relative to the capital employed in the business. Analysts use this formula to calculate it for TRC Synergy Berhad:
Return on Capital Employed = Earnings Before Interest and Tax (EBIT) ÷ (Total Assets - Current Liabilities)
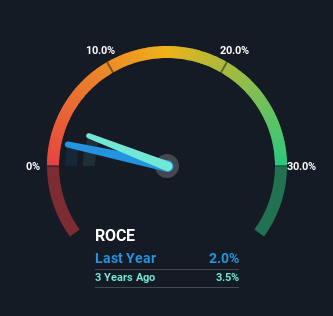
0.02 = RM14m ÷ (RM985m - RM301m) (Based on the trailing twelve months to December 2023).
So, TRC Synergy Berhad has an ROCE of 2.0%. In absolute terms, that's a low return and it also under-performs the Construction industry average of 6.6%.
View our latest analysis for TRC Synergy Berhad
In the above chart we have measured TRC Synergy Berhad's prior ROCE against its prior performance, but the future is arguably more important. If you're interested, you can view the analysts predictions in our free analyst report for TRC Synergy Berhad .
What Can We Tell From TRC Synergy Berhad's ROCE Trend?
When we looked at the ROCE trend at TRC Synergy Berhad, we didn't gain much confidence. Over the last five years, returns on capital have decreased to 2.0% from 6.8% five years ago. Meanwhile, the business is utilizing more capital but this hasn't moved the needle much in terms of sales in the past 12 months, so this could reflect longer term investments. It may take some time before the company starts to see any change in earnings from these investments.
On a related note, TRC Synergy Berhad has decreased its current liabilities to 31% of total assets. So we could link some of this to the decrease in ROCE. Effectively this means their suppliers or short-term creditors are funding less of the business, which reduces some elements of risk. Since the business is basically funding more of its operations with it's own money, you could argue this has made the business less efficient at generating ROCE.
In Conclusion...
To conclude, we've found that TRC Synergy Berhad is reinvesting in the business, but returns have been falling. Since the stock has declined 18% over the last five years, investors may not be too optimistic on this trend improving either. On the whole, we aren't too inspired by the underlying trends and we think there may be better chances of finding a multi-bagger elsewhere.
One more thing: We've identified 4 warning signs with TRC Synergy Berhad (at least 1 which is a bit unpleasant) , and understanding these would certainly be useful.
While TRC Synergy Berhad isn't earning the highest return, check out this free list of companies that are earning high returns on equity with solid balance sheets.
Valuation is complex, but we're here to simplify it.
Discover if TRC Synergy Berhad might be undervalued or overvalued with our detailed analysis, featuring fair value estimates, potential risks, dividends, insider trades, and its financial condition.
Access Free AnalysisHave feedback on this article? Concerned about the content? Get in touch with us directly. Alternatively, email editorial-team (at) simplywallst.com.
This article by Simply Wall St is general in nature. We provide commentary based on historical data and analyst forecasts only using an unbiased methodology and our articles are not intended to be financial advice. It does not constitute a recommendation to buy or sell any stock, and does not take account of your objectives, or your financial situation. We aim to bring you long-term focused analysis driven by fundamental data. Note that our analysis may not factor in the latest price-sensitive company announcements or qualitative material. Simply Wall St has no position in any stocks mentioned.
About KLSE:TRC
TRC Synergy Berhad
An investment holding company, operates in the construction business in Malaysia and Australia.
Excellent balance sheet with reasonable growth potential.
Market Insights

Community Narratives

