- Malaysia
- /
- Industrials
- /
- KLSE:SIME
Investors in Sime Darby Berhad (KLSE:SIME) have seen notable returns of 35% over the past year


Passive investing in index funds can generate returns that roughly match the overall market. But if you pick the right individual stocks, you could make more than that. To wit, the Sime Darby Berhad (KLSE:SIME) share price is 28% higher than it was a year ago, much better than the market return of around 20% (not including dividends) in the same period. So that should have shareholders smiling. However, the stock hasn't done so well in the longer term, with the stock only up 21% in three years.
So let's investigate and see if the longer term performance of the company has been in line with the underlying business' progress.
View our latest analysis for Sime Darby Berhad
To quote Buffett, 'Ships will sail around the world but the Flat Earth Society will flourish. There will continue to be wide discrepancies between price and value in the marketplace...' One imperfect but simple way to consider how the market perception of a company has shifted is to compare the change in the earnings per share (EPS) with the share price movement.
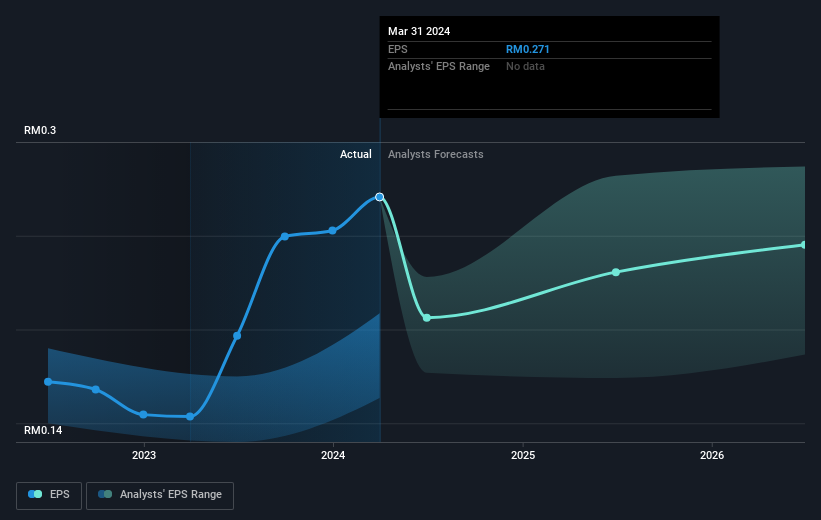
During the last year Sime Darby Berhad grew its earnings per share (EPS) by 76%. It's fair to say that the share price gain of 28% did not keep pace with the EPS growth. Therefore, it seems the market isn't as excited about Sime Darby Berhad as it was before. This could be an opportunity. This cautious sentiment is reflected in its (fairly low) P/E ratio of 9.68.
The image below shows how EPS has tracked over time (if you click on the image you can see greater detail).
We know that Sime Darby Berhad has improved its bottom line lately, but is it going to grow revenue? You could check out this free report showing analyst revenue forecasts.
What About Dividends?
It is important to consider the total shareholder return, as well as the share price return, for any given stock. Whereas the share price return only reflects the change in the share price, the TSR includes the value of dividends (assuming they were reinvested) and the benefit of any discounted capital raising or spin-off. Arguably, the TSR gives a more comprehensive picture of the return generated by a stock. In the case of Sime Darby Berhad, it has a TSR of 35% for the last 1 year. That exceeds its share price return that we previously mentioned. This is largely a result of its dividend payments!
A Different Perspective
We're pleased to report that Sime Darby Berhad shareholders have received a total shareholder return of 35% over one year. That's including the dividend. Since the one-year TSR is better than the five-year TSR (the latter coming in at 8% per year), it would seem that the stock's performance has improved in recent times. In the best case scenario, this may hint at some real business momentum, implying that now could be a great time to delve deeper. I find it very interesting to look at share price over the long term as a proxy for business performance. But to truly gain insight, we need to consider other information, too. Even so, be aware that Sime Darby Berhad is showing 1 warning sign in our investment analysis , you should know about...
If you like to buy stocks alongside management, then you might just love this free list of companies. (Hint: many of them are unnoticed AND have attractive valuation).
Please note, the market returns quoted in this article reflect the market weighted average returns of stocks that currently trade on Malaysian exchanges.
New: Manage All Your Stock Portfolios in One Place
We've created the ultimate portfolio companion for stock investors, and it's free.
• Connect an unlimited number of Portfolios and see your total in one currency
• Be alerted to new Warning Signs or Risks via email or mobile
• Track the Fair Value of your stocks
Have feedback on this article? Concerned about the content? Get in touch with us directly. Alternatively, email editorial-team (at) simplywallst.com.
This article by Simply Wall St is general in nature. We provide commentary based on historical data and analyst forecasts only using an unbiased methodology and our articles are not intended to be financial advice. It does not constitute a recommendation to buy or sell any stock, and does not take account of your objectives, or your financial situation. We aim to bring you long-term focused analysis driven by fundamental data. Note that our analysis may not factor in the latest price-sensitive company announcements or qualitative material. Simply Wall St has no position in any stocks mentioned.
Have feedback on this article? Concerned about the content? Get in touch with us directly. Alternatively, email editorial-team@simplywallst.com
About KLSE:SIME
Sime Darby Berhad
An investment holding company, operates in the industrial, motors, and other businesses in Malaysia, China, Australia, and internationally.
Very undervalued with excellent balance sheet and pays a dividend.
Similar Companies
Market Insights

Community Narratives


