
Advertisement
Seacera Group Berhad (KLSE:SEACERA) Is Doing The Right Things To Multiply Its Share Price

If we want to find a stock that could multiply over the long term, what are the underlying trends we should look for? Firstly, we'd want to identify a growing return on capital employed (ROCE) and then alongside that, an ever-increasing base of capital employed. This shows us that it's a compounding machine, able to continually reinvest its earnings back into the business and generate higher returns. So on that note, Seacera Group Berhad (KLSE:SEACERA) looks quite promising in regards to its trends of return on capital.
Return On Capital Employed (ROCE): What Is It?
For those who don't know, ROCE is a measure of a company's yearly pre-tax profit (its return), relative to the capital employed in the business. Analysts use this formula to calculate it for Seacera Group Berhad:
Return on Capital Employed = Earnings Before Interest and Tax (EBIT) ÷ (Total Assets - Current Liabilities)
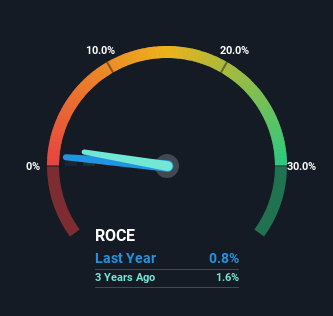
0.0083 = RM6.6m ÷ (RM830m - RM24m) (Based on the trailing twelve months to June 2023).
Therefore, Seacera Group Berhad has an ROCE of 0.8%. Ultimately, that's a low return and it under-performs the Building industry average of 7.1%.
See our latest analysis for Seacera Group Berhad
While the past is not representative of the future, it can be helpful to know how a company has performed historically, which is why we have this chart above. If you're interested in investigating Seacera Group Berhad's past further, check out this free graph of past earnings, revenue and cash flow.
How Are Returns Trending?
Even though ROCE is still low in absolute terms, it's good to see it's heading in the right direction. Looking at the data, we can see that even though capital employed in the business has remained relatively flat, the ROCE generated has risen by 191% over the last five years. Basically the business is generating higher returns from the same amount of capital and that is proof that there are improvements in the company's efficiencies. It's worth looking deeper into this though because while it's great that the business is more efficient, it might also mean that going forward the areas to invest internally for the organic growth are lacking.
In another part of our analysis, we noticed that the company's ratio of current liabilities to total assets decreased to 2.9%, which broadly means the business is relying less on its suppliers or short-term creditors to fund its operations. This tells us that Seacera Group Berhad has grown its returns without a reliance on increasing their current liabilities, which we're very happy with.
Our Take On Seacera Group Berhad's ROCE
In summary, we're delighted to see that Seacera Group Berhad has been able to increase efficiencies and earn higher rates of return on the same amount of capital. Considering the stock has delivered 17% to its stockholders over the last five years, it may be fair to think that investors aren't fully aware of the promising trends yet. Given that, we'd look further into this stock in case it has more traits that could make it multiply in the long term.
One more thing: We've identified 2 warning signs with Seacera Group Berhad (at least 1 which is a bit unpleasant) , and understanding these would certainly be useful.
While Seacera Group Berhad may not currently earn the highest returns, we've compiled a list of companies that currently earn more than 25% return on equity. Check out this free list here.
New: Manage All Your Stock Portfolios in One Place
We've created the ultimate portfolio companion for stock investors, and it's free.
• Connect an unlimited number of Portfolios and see your total in one currency
• Be alerted to new Warning Signs or Risks via email or mobile
• Track the Fair Value of your stocks
Have feedback on this article? Concerned about the content? Get in touch with us directly. Alternatively, email editorial-team (at) simplywallst.com.
This article by Simply Wall St is general in nature. We provide commentary based on historical data and analyst forecasts only using an unbiased methodology and our articles are not intended to be financial advice. It does not constitute a recommendation to buy or sell any stock, and does not take account of your objectives, or your financial situation. We aim to bring you long-term focused analysis driven by fundamental data. Note that our analysis may not factor in the latest price-sensitive company announcements or qualitative material. Simply Wall St has no position in any stocks mentioned.
About KLSE:SEACERA
Seacera Group Berhad
Engages in the trading of building materials in Malaysia.
Excellent balance sheet with questionable track record.
Market Insights

Advertisement
Community Narratives
The Most Undervalued of the Magnificent 7
Fair Value US$237.43|36.3% undervalued
IN
Community Contributor
PVA TePla's New Strategy Aims for 22% Revenue Growth in Semiconductor Recovery
Fair Value €19.19|20.8% undervalued
MI
Community Contributor