- Malaysia
- /
- Construction
- /
- KLSE:PJBUMI
PJBumi Berhad's (KLSE:PJBUMI) Stock On An Uptrend: Could Fundamentals Be Driving The Momentum?


PJBumi Berhad's (KLSE:PJBUMI) stock is up by a considerable 48% over the past three months. We wonder if and what role the company's financials play in that price change as a company's long-term fundamentals usually dictate market outcomes. Particularly, we will be paying attention to PJBumi Berhad's ROE today.
Return on equity or ROE is an important factor to be considered by a shareholder because it tells them how effectively their capital is being reinvested. In other words, it is a profitability ratio which measures the rate of return on the capital provided by the company's shareholders.
View our latest analysis for PJBumi Berhad
How Is ROE Calculated?
Return on equity can be calculated by using the formula:
Return on Equity = Net Profit (from continuing operations) ÷ Shareholders' Equity
So, based on the above formula, the ROE for PJBumi Berhad is:
0.9% = RM205k ÷ RM23m (Based on the trailing twelve months to September 2020).
The 'return' is the amount earned after tax over the last twelve months. One way to conceptualize this is that for each MYR1 of shareholders' capital it has, the company made MYR0.01 in profit.
What Has ROE Got To Do With Earnings Growth?
So far, we've learned that ROE is a measure of a company's profitability. Depending on how much of these profits the company reinvests or "retains", and how effectively it does so, we are then able to assess a company’s earnings growth potential. Assuming all else is equal, companies that have both a higher return on equity and higher profit retention are usually the ones that have a higher growth rate when compared to companies that don't have the same features.
PJBumi Berhad's Earnings Growth And 0.9% ROE
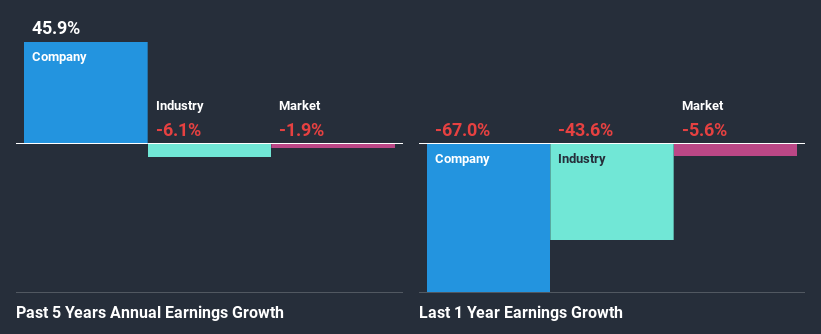
It is quite clear that PJBumi Berhad's ROE is rather low. Not just that, even compared to the industry average of 4.4%, the company's ROE is entirely unremarkable. Despite this, surprisingly, PJBumi Berhad saw an exceptional 46% net income growth over the past five years. Therefore, there could be other reasons behind this growth. For example, it is possible that the company's management has made some good strategic decisions, or that the company has a low payout ratio.
Given that the industry shrunk its earnings at a rate of 6.1% in the same period, the net income growth of the company is quite impressive.
Earnings growth is an important metric to consider when valuing a stock. The investor should try to establish if the expected growth or decline in earnings, whichever the case may be, is priced in. This then helps them determine if the stock is placed for a bright or bleak future. If you're wondering about PJBumi Berhad's's valuation, check out this gauge of its price-to-earnings ratio, as compared to its industry.
Is PJBumi Berhad Making Efficient Use Of Its Profits?
Summary
In total, it does look like PJBumi Berhad has some positive aspects to its business. Even in spite of the low rate of return, the company has posted impressive earnings growth as a result of reinvesting heavily into its business. While we won't completely dismiss the company, what we would do, is try to ascertain how risky the business is to make a more informed decision around the company. You can see the 4 risks we have identified for PJBumi Berhad by visiting our risks dashboard for free on our platform here.
If you’re looking to trade PJBumi Berhad, open an account with the lowest-cost* platform trusted by professionals, Interactive Brokers. Their clients from over 200 countries and territories trade stocks, options, futures, forex, bonds and funds worldwide from a single integrated account. Promoted
If you're looking to trade PJBumi Berhad, open an account with the lowest-cost platform trusted by professionals, Interactive Brokers.
With clients in over 200 countries and territories, and access to 160 markets, IBKR lets you trade stocks, options, futures, forex, bonds and funds from a single integrated account.
Enjoy no hidden fees, no account minimums, and FX conversion rates as low as 0.03%, far better than what most brokers offer.
Sponsored ContentNew: Manage All Your Stock Portfolios in One Place
We've created the ultimate portfolio companion for stock investors, and it's free.
• Connect an unlimited number of Portfolios and see your total in one currency
• Be alerted to new Warning Signs or Risks via email or mobile
• Track the Fair Value of your stocks
This article by Simply Wall St is general in nature. It does not constitute a recommendation to buy or sell any stock, and does not take account of your objectives, or your financial situation. We aim to bring you long-term focused analysis driven by fundamental data. Note that our analysis may not factor in the latest price-sensitive company announcements or qualitative material. Simply Wall St has no position in any stocks mentioned.
*Interactive Brokers Rated Lowest Cost Broker by StockBrokers.com Annual Online Review 2020
Have feedback on this article? Concerned about the content? Get in touch with us directly. Alternatively, email editorial-team (at) simplywallst.com.
About KLSE:PJBUMI
PJBumi Berhad
An investment holding company, provides engineering and construction services in Malaysia.
Adequate balance sheet low.
Market Insights

Community Narratives


