
Advertisement
Is Kim Hin Industry Berhad (KLSE:KIMHIN) Using Debt Sensibly?

The external fund manager backed by Berkshire Hathaway's Charlie Munger, Li Lu, makes no bones about it when he says 'The biggest investment risk is not the volatility of prices, but whether you will suffer a permanent loss of capital.' It's only natural to consider a company's balance sheet when you examine how risky it is, since debt is often involved when a business collapses. We note that Kim Hin Industry Berhad (KLSE:KIMHIN) does have debt on its balance sheet. But the real question is whether this debt is making the company risky.
What Risk Does Debt Bring?
Debt is a tool to help businesses grow, but if a business is incapable of paying off its lenders, then it exists at their mercy. Ultimately, if the company can't fulfill its legal obligations to repay debt, shareholders could walk away with nothing. While that is not too common, we often do see indebted companies permanently diluting shareholders because lenders force them to raise capital at a distressed price. By replacing dilution, though, debt can be an extremely good tool for businesses that need capital to invest in growth at high rates of return. The first step when considering a company's debt levels is to consider its cash and debt together.
Check out our latest analysis for Kim Hin Industry Berhad
How Much Debt Does Kim Hin Industry Berhad Carry?
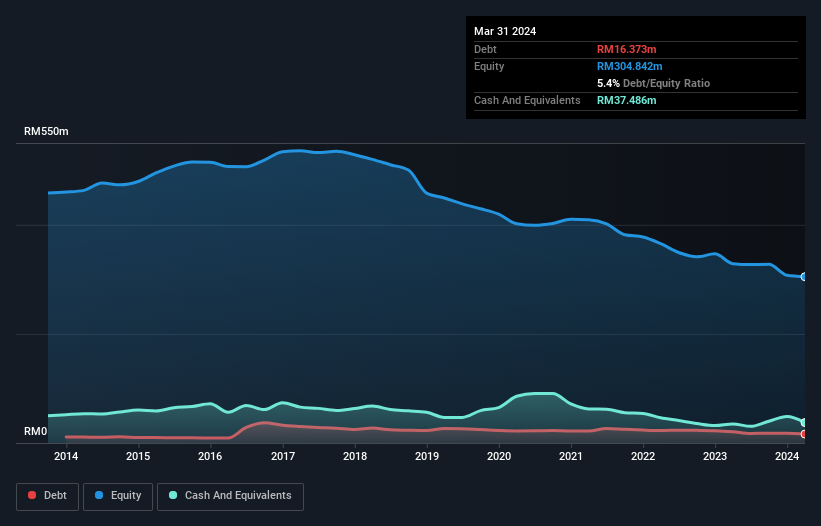
As you can see below, Kim Hin Industry Berhad had RM16.4m of debt at March 2024, down from RM20.7m a year prior. However, it does have RM37.5m in cash offsetting this, leading to net cash of RM21.1m.
How Strong Is Kim Hin Industry Berhad's Balance Sheet?
Zooming in on the latest balance sheet data, we can see that Kim Hin Industry Berhad had liabilities of RM94.7m due within 12 months and liabilities of RM26.1m due beyond that. Offsetting these obligations, it had cash of RM37.5m as well as receivables valued at RM59.5m due within 12 months. So its liabilities outweigh the sum of its cash and (near-term) receivables by RM23.7m.
While this might seem like a lot, it is not so bad since Kim Hin Industry Berhad has a market capitalization of RM76.4m, and so it could probably strengthen its balance sheet by raising capital if it needed to. However, it is still worthwhile taking a close look at its ability to pay off debt. While it does have liabilities worth noting, Kim Hin Industry Berhad also has more cash than debt, so we're pretty confident it can manage its debt safely. The balance sheet is clearly the area to focus on when you are analysing debt. But it is Kim Hin Industry Berhad's earnings that will influence how the balance sheet holds up in the future. So if you're keen to discover more about its earnings, it might be worth checking out this graph of its long term earnings trend.
Over 12 months, Kim Hin Industry Berhad made a loss at the EBIT level, and saw its revenue drop to RM317m, which is a fall of 3.0%. We would much prefer see growth.
So How Risky Is Kim Hin Industry Berhad?
While Kim Hin Industry Berhad lost money on an earnings before interest and tax (EBIT) level, it actually generated positive free cash flow RM6.7m. So although it is loss-making, it doesn't seem to have too much near-term balance sheet risk, keeping in mind the net cash. With revenue growth uninspiring, we'd really need to see some positive EBIT before mustering much enthusiasm for this business. When analysing debt levels, the balance sheet is the obvious place to start. But ultimately, every company can contain risks that exist outside of the balance sheet. Case in point: We've spotted 1 warning sign for Kim Hin Industry Berhad you should be aware of.
At the end of the day, it's often better to focus on companies that are free from net debt. You can access our special list of such companies (all with a track record of profit growth). It's free.
Valuation is complex, but we're here to simplify it.
Discover if Kim Hin Industry Berhad might be undervalued or overvalued with our detailed analysis, featuring fair value estimates, potential risks, dividends, insider trades, and its financial condition.
Access Free AnalysisHave feedback on this article? Concerned about the content? Get in touch with us directly. Alternatively, email editorial-team (at) simplywallst.com.
This article by Simply Wall St is general in nature. We provide commentary based on historical data and analyst forecasts only using an unbiased methodology and our articles are not intended to be financial advice. It does not constitute a recommendation to buy or sell any stock, and does not take account of your objectives, or your financial situation. We aim to bring you long-term focused analysis driven by fundamental data. Note that our analysis may not factor in the latest price-sensitive company announcements or qualitative material. Simply Wall St has no position in any stocks mentioned.
About KLSE:KIMHIN
Kim Hin Industry Berhad
An investment holding company, engages in the production and distribution of ceramic floor, homogeneous, and monoporosa tiles in Malaysia.
Flawless balance sheet low.
Market Insights

Advertisement
Community Narratives

Apple: A Dying Star with an Overpriced Valuation
Fair Value US$177.34|20.1% overvalued
IN
Community Contributor
Avino a case for USD$20 per share within 5 years (assuming $3,500 gold, $100 silver and $4 copper).
Fair Value CA$26.79|87.5% undervalued
AG
Community Contributor
Riding the Defense Boom RENK Sees Revenue Climb at 15% CAGR by FY 2029
Fair Value €69.87|20.5% undervalued
CH
Community Contributor