
Advertisement
Health Check: How Prudently Does Kim Hin Industry Berhad (KLSE:KIMHIN) Use Debt?

Warren Buffett famously said, 'Volatility is far from synonymous with risk.' So it might be obvious that you need to consider debt, when you think about how risky any given stock is, because too much debt can sink a company. Importantly, Kim Hin Industry Berhad (KLSE:KIMHIN) does carry debt. But is this debt a concern to shareholders?
What Risk Does Debt Bring?
Debt and other liabilities become risky for a business when it cannot easily fulfill those obligations, either with free cash flow or by raising capital at an attractive price. Ultimately, if the company can't fulfill its legal obligations to repay debt, shareholders could walk away with nothing. However, a more common (but still painful) scenario is that it has to raise new equity capital at a low price, thus permanently diluting shareholders. Of course, plenty of companies use debt to fund growth, without any negative consequences. When we think about a company's use of debt, we first look at cash and debt together.
See our latest analysis for Kim Hin Industry Berhad
What Is Kim Hin Industry Berhad's Net Debt?
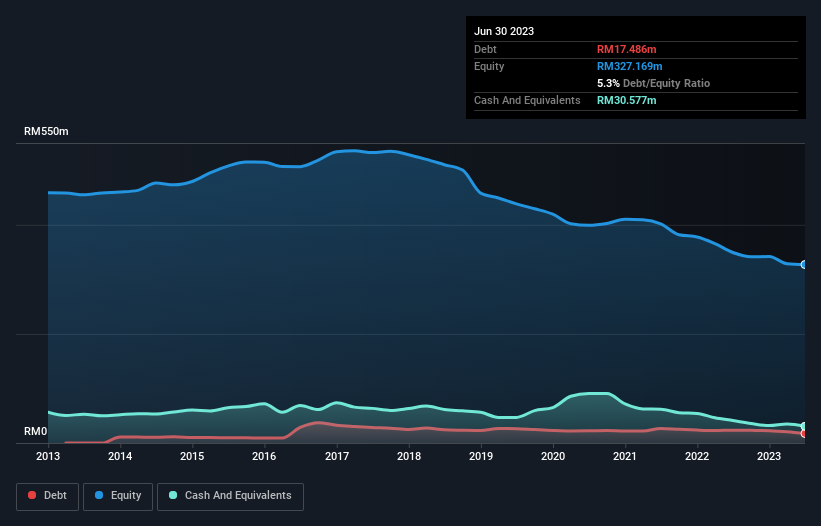
As you can see below, Kim Hin Industry Berhad had RM17.5m of debt at June 2023, down from RM23.6m a year prior. But on the other hand it also has RM30.6m in cash, leading to a RM13.1m net cash position.
How Strong Is Kim Hin Industry Berhad's Balance Sheet?
According to the last reported balance sheet, Kim Hin Industry Berhad had liabilities of RM92.0m due within 12 months, and liabilities of RM35.3m due beyond 12 months. Offsetting these obligations, it had cash of RM30.6m as well as receivables valued at RM54.7m due within 12 months. So its liabilities total RM42.1m more than the combination of its cash and short-term receivables.
This deficit isn't so bad because Kim Hin Industry Berhad is worth RM76.4m, and thus could probably raise enough capital to shore up its balance sheet, if the need arose. But it's clear that we should definitely closely examine whether it can manage its debt without dilution. While it does have liabilities worth noting, Kim Hin Industry Berhad also has more cash than debt, so we're pretty confident it can manage its debt safely. There's no doubt that we learn most about debt from the balance sheet. But you can't view debt in total isolation; since Kim Hin Industry Berhad will need earnings to service that debt. So if you're keen to discover more about its earnings, it might be worth checking out this graph of its long term earnings trend.
In the last year Kim Hin Industry Berhad had a loss before interest and tax, and actually shrunk its revenue by 3.6%, to RM324m. That's not what we would hope to see.
So How Risky Is Kim Hin Industry Berhad?
By their very nature companies that are losing money are more risky than those with a long history of profitability. And in the last year Kim Hin Industry Berhad had an earnings before interest and tax (EBIT) loss, truth be told. And over the same period it saw negative free cash outflow of RM2.2m and booked a RM28m accounting loss. Given it only has net cash of RM13.1m, the company may need to raise more capital if it doesn't reach break-even soon. Summing up, we're a little skeptical of this one, as it seems fairly risky in the absence of free cashflow. When analysing debt levels, the balance sheet is the obvious place to start. However, not all investment risk resides within the balance sheet - far from it. Case in point: We've spotted 2 warning signs for Kim Hin Industry Berhad you should be aware of.
Of course, if you're the type of investor who prefers buying stocks without the burden of debt, then don't hesitate to discover our exclusive list of net cash growth stocks, today.
Valuation is complex, but we're here to simplify it.
Discover if Kim Hin Industry Berhad might be undervalued or overvalued with our detailed analysis, featuring fair value estimates, potential risks, dividends, insider trades, and its financial condition.
Access Free AnalysisHave feedback on this article? Concerned about the content? Get in touch with us directly. Alternatively, email editorial-team (at) simplywallst.com.
This article by Simply Wall St is general in nature. We provide commentary based on historical data and analyst forecasts only using an unbiased methodology and our articles are not intended to be financial advice. It does not constitute a recommendation to buy or sell any stock, and does not take account of your objectives, or your financial situation. We aim to bring you long-term focused analysis driven by fundamental data. Note that our analysis may not factor in the latest price-sensitive company announcements or qualitative material. Simply Wall St has no position in any stocks mentioned.
About KLSE:KIMHIN
Kim Hin Industry Berhad
An investment holding company, engages in the production and distribution of ceramic floor, homogeneous, and monoporosa tiles in Malaysia.
Flawless balance sheet low.
Market Insights

Advertisement
Community Narratives

Apple: A Dying Star with an Overpriced Valuation
Fair Value US$177.34|20.1% overvalued
IN
Community Contributor
Avino a case for USD$20 per share within 5 years (assuming $3,500 gold, $100 silver and $4 copper).
Fair Value CA$26.79|87.5% undervalued
AG
Community Contributor
Riding the Defense Boom RENK Sees Revenue Climb at 15% CAGR by FY 2029
Fair Value €69.87|20.5% undervalued
CH
Community Contributor