- Malaysia
- /
- Construction
- /
- KLSE:GKENT
George Kent (Malaysia) Berhad (KLSE:GKENT) Will Want To Turn Around Its Return Trends


If we want to find a potential multi-bagger, often there are underlying trends that can provide clues. Firstly, we'd want to identify a growing return on capital employed (ROCE) and then alongside that, an ever-increasing base of capital employed. This shows us that it's a compounding machine, able to continually reinvest its earnings back into the business and generate higher returns. In light of that, when we looked at George Kent (Malaysia) Berhad (KLSE:GKENT) and its ROCE trend, we weren't exactly thrilled.
Return On Capital Employed (ROCE): What Is It?
For those who don't know, ROCE is a measure of a company's yearly pre-tax profit (its return), relative to the capital employed in the business. The formula for this calculation on George Kent (Malaysia) Berhad is:
Return on Capital Employed = Earnings Before Interest and Tax (EBIT) ÷ (Total Assets - Current Liabilities)
0.021 = RM14m ÷ (RM800m - RM130m) (Based on the trailing twelve months to June 2023).
Thus, George Kent (Malaysia) Berhad has an ROCE of 2.1%. Ultimately, that's a low return and it under-performs the Construction industry average of 6.1%.
View our latest analysis for George Kent (Malaysia) Berhad
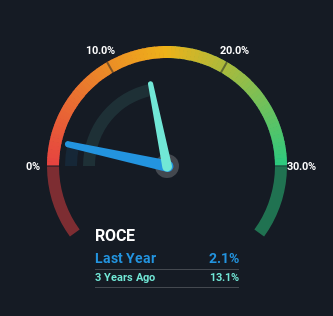
Historical performance is a great place to start when researching a stock so above you can see the gauge for George Kent (Malaysia) Berhad's ROCE against it's prior returns. If you're interested in investigating George Kent (Malaysia) Berhad's past further, check out this free graph of past earnings, revenue and cash flow.
What Can We Tell From George Kent (Malaysia) Berhad's ROCE Trend?
When we looked at the ROCE trend at George Kent (Malaysia) Berhad, we didn't gain much confidence. Over the last five years, returns on capital have decreased to 2.1% from 37% five years ago. And considering revenue has dropped while employing more capital, we'd be cautious. This could mean that the business is losing its competitive advantage or market share, because while more money is being put into ventures, it's actually producing a lower return - "less bang for their buck" per se.
On a side note, George Kent (Malaysia) Berhad has done well to pay down its current liabilities to 16% of total assets. That could partly explain why the ROCE has dropped. What's more, this can reduce some aspects of risk to the business because now the company's suppliers or short-term creditors are funding less of its operations. Since the business is basically funding more of its operations with it's own money, you could argue this has made the business less efficient at generating ROCE.
The Bottom Line
In summary, we're somewhat concerned by George Kent (Malaysia) Berhad's diminishing returns on increasing amounts of capital. Long term shareholders who've owned the stock over the last five years have experienced a 43% depreciation in their investment, so it appears the market might not like these trends either. That being the case, unless the underlying trends revert to a more positive trajectory, we'd consider looking elsewhere.
If you want to know some of the risks facing George Kent (Malaysia) Berhad we've found 3 warning signs (1 is concerning!) that you should be aware of before investing here.
While George Kent (Malaysia) Berhad may not currently earn the highest returns, we've compiled a list of companies that currently earn more than 25% return on equity. Check out this free list here.
New: Manage All Your Stock Portfolios in One Place
We've created the ultimate portfolio companion for stock investors, and it's free.
• Connect an unlimited number of Portfolios and see your total in one currency
• Be alerted to new Warning Signs or Risks via email or mobile
• Track the Fair Value of your stocks
Have feedback on this article? Concerned about the content? Get in touch with us directly. Alternatively, email editorial-team (at) simplywallst.com.
This article by Simply Wall St is general in nature. We provide commentary based on historical data and analyst forecasts only using an unbiased methodology and our articles are not intended to be financial advice. It does not constitute a recommendation to buy or sell any stock, and does not take account of your objectives, or your financial situation. We aim to bring you long-term focused analysis driven by fundamental data. Note that our analysis may not factor in the latest price-sensitive company announcements or qualitative material. Simply Wall St has no position in any stocks mentioned.
About KLSE:GKENT
George Kent (Malaysia) Berhad
Provides various metering products for residential, industrial, and commercial customers in Malaysia and internationally.
Mediocre balance sheet low.
Market Insights

Community Narratives
