
Advertisement
- Malaysia
- /
- Trade Distributors
- /
- KLSE:CHINHIN
Capital Allocation Trends At Chin Hin Group Berhad (KLSE:CHINHIN) Aren't Ideal

What trends should we look for it we want to identify stocks that can multiply in value over the long term? In a perfect world, we'd like to see a company investing more capital into its business and ideally the returns earned from that capital are also increasing. This shows us that it's a compounding machine, able to continually reinvest its earnings back into the business and generate higher returns. Having said that, from a first glance at Chin Hin Group Berhad (KLSE:CHINHIN) we aren't jumping out of our chairs at how returns are trending, but let's have a deeper look.
Return On Capital Employed (ROCE): What Is It?
If you haven't worked with ROCE before, it measures the 'return' (pre-tax profit) a company generates from capital employed in its business. To calculate this metric for Chin Hin Group Berhad, this is the formula:
Return on Capital Employed = Earnings Before Interest and Tax (EBIT) ÷ (Total Assets - Current Liabilities)
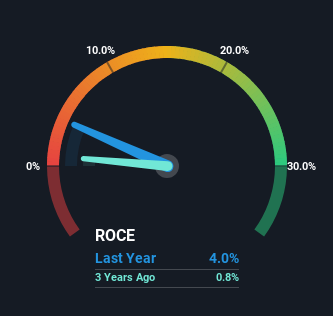
0.04 = RM72m ÷ (RM3.2b - RM1.4b) (Based on the trailing twelve months to December 2023).
So, Chin Hin Group Berhad has an ROCE of 4.0%. In absolute terms, that's a low return and it also under-performs the Trade Distributors industry average of 9.8%.
View our latest analysis for Chin Hin Group Berhad
While the past is not representative of the future, it can be helpful to know how a company has performed historically, which is why we have this chart above. If you'd like to look at how Chin Hin Group Berhad has performed in the past in other metrics, you can view this free graph of Chin Hin Group Berhad's past earnings, revenue and cash flow.
So How Is Chin Hin Group Berhad's ROCE Trending?
In terms of Chin Hin Group Berhad's historical ROCE movements, the trend isn't fantastic. Around five years ago the returns on capital were 8.5%, but since then they've fallen to 4.0%. Although, given both revenue and the amount of assets employed in the business have increased, it could suggest the company is investing in growth, and the extra capital has led to a short-term reduction in ROCE. And if the increased capital generates additional returns, the business, and thus shareholders, will benefit in the long run.
On a related note, Chin Hin Group Berhad has decreased its current liabilities to 43% of total assets. So we could link some of this to the decrease in ROCE. Effectively this means their suppliers or short-term creditors are funding less of the business, which reduces some elements of risk. Some would claim this reduces the business' efficiency at generating ROCE since it is now funding more of the operations with its own money. Either way, they're still at a pretty high level, so we'd like to see them fall further if possible.
The Key Takeaway
While returns have fallen for Chin Hin Group Berhad in recent times, we're encouraged to see that sales are growing and that the business is reinvesting in its operations. And long term investors must be optimistic going forward because the stock has returned a huge 1,552% to shareholders in the last five years. So should these growth trends continue, we'd be optimistic on the stock going forward.
If you'd like to know more about Chin Hin Group Berhad, we've spotted 2 warning signs, and 1 of them is significant.
If you want to search for solid companies with great earnings, check out this free list of companies with good balance sheets and impressive returns on equity.
New: AI Stock Screener & Alerts
Our new AI Stock Screener scans the market every day to uncover opportunities.
• Dividend Powerhouses (3%+ Yield)
• Undervalued Small Caps with Insider Buying
• High growth Tech and AI Companies
Or build your own from over 50 metrics.
Have feedback on this article? Concerned about the content? Get in touch with us directly. Alternatively, email editorial-team (at) simplywallst.com.
This article by Simply Wall St is general in nature. We provide commentary based on historical data and analyst forecasts only using an unbiased methodology and our articles are not intended to be financial advice. It does not constitute a recommendation to buy or sell any stock, and does not take account of your objectives, or your financial situation. We aim to bring you long-term focused analysis driven by fundamental data. Note that our analysis may not factor in the latest price-sensitive company announcements or qualitative material. Simply Wall St has no position in any stocks mentioned.
About KLSE:CHINHIN
Adequate balance sheet low.
Similar Companies
Market Insights

Advertisement
Community Narratives
Groundbreaking therapies that could change the treatment landscape for PTSD, fibromyalgia, MS & Alzheimer’s
Fair Value US$6.20|86.9% undervalued
CM
Community Contributor
DigitalOcean Will Grow 14% by Embracing AI with Paperspace Acquisition
Fair Value US$50.00|41.7% undervalued
NE
Community Contributor
Viant Technology: A Rising AdTech Challenger in the AI-Powered CTV Market
Fair Value US$38.61|63.2% undervalued
BL
Community Contributor
Volvo will Accelerate Forward into Electric and Autonomous Leadership in Five Years
Fair Value SEK 438.80|39.7% undervalued
UN
Community Contributor