
Advertisement
CB Industrial Product Holding Berhad (KLSE:CBIP) Share Prices Have Dropped 46% In The Last Five Years

While not a mind-blowing move, it is good to see that the CB Industrial Product Holding Berhad (KLSE:CBIP) share price has gained 22% in the last three months. But that doesn't change the fact that the returns over the last five years have been less than pleasing. After all, the share price is down 46% in that time, significantly under-performing the market.
Check out our latest analysis for CB Industrial Product Holding Berhad
While markets are a powerful pricing mechanism, share prices reflect investor sentiment, not just underlying business performance. By comparing earnings per share (EPS) and share price changes over time, we can get a feel for how investor attitudes to a company have morphed over time.
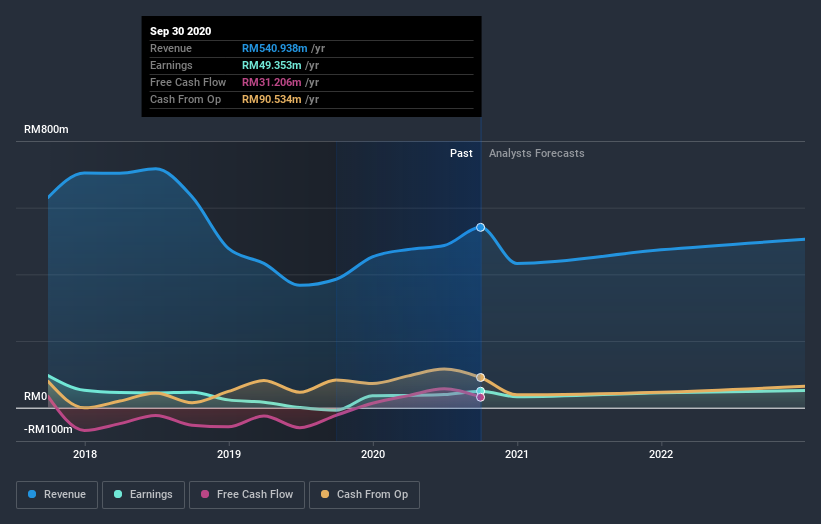
During five years of share price growth, CB Industrial Product Holding Berhad moved from a loss to profitability. That would generally be considered a positive, so we are surprised to see the share price is down. Other metrics may better explain the share price move.
Arguably, the revenue drop of 4.9% a year for half a decade suggests that the company can't grow in the long term. That could explain the weak share price.
You can see how earnings and revenue have changed over time in the image below (click on the chart to see the exact values).
We're pleased to report that the CEO is remunerated more modestly than most CEOs at similarly capitalized companies. It's always worth keeping an eye on CEO pay, but a more important question is whether the company will grow earnings throughout the years. So it makes a lot of sense to check out what analysts think CB Industrial Product Holding Berhad will earn in the future (free profit forecasts).
What About Dividends?
It is important to consider the total shareholder return, as well as the share price return, for any given stock. The TSR incorporates the value of any spin-offs or discounted capital raisings, along with any dividends, based on the assumption that the dividends are reinvested. Arguably, the TSR gives a more comprehensive picture of the return generated by a stock. In the case of CB Industrial Product Holding Berhad, it has a TSR of -36% for the last 5 years. That exceeds its share price return that we previously mentioned. The dividends paid by the company have thusly boosted the total shareholder return.
A Different Perspective
It's nice to see that CB Industrial Product Holding Berhad shareholders have received a total shareholder return of 5.9% over the last year. And that does include the dividend. That certainly beats the loss of about 6% per year over the last half decade. This makes us a little wary, but the business might have turned around its fortunes. I find it very interesting to look at share price over the long term as a proxy for business performance. But to truly gain insight, we need to consider other information, too. To that end, you should be aware of the 1 warning sign we've spotted with CB Industrial Product Holding Berhad .
We will like CB Industrial Product Holding Berhad better if we see some big insider buys. While we wait, check out this free list of growing companies with considerable, recent, insider buying.
Please note, the market returns quoted in this article reflect the market weighted average returns of stocks that currently trade on MY exchanges.
If you decide to trade CB Industrial Product Holding Berhad, use the lowest-cost* platform that is rated #1 Overall by Barron’s, Interactive Brokers. Trade stocks, options, futures, forex, bonds and funds on 135 markets, all from a single integrated account. Promoted
New: AI Stock Screener & Alerts
Our new AI Stock Screener scans the market every day to uncover opportunities.
• Dividend Powerhouses (3%+ Yield)
• Undervalued Small Caps with Insider Buying
• High growth Tech and AI Companies
Or build your own from over 50 metrics.
This article by Simply Wall St is general in nature. It does not constitute a recommendation to buy or sell any stock, and does not take account of your objectives, or your financial situation. We aim to bring you long-term focused analysis driven by fundamental data. Note that our analysis may not factor in the latest price-sensitive company announcements or qualitative material. Simply Wall St has no position in any stocks mentioned.
*Interactive Brokers Rated Lowest Cost Broker by StockBrokers.com Annual Online Review 2020
Have feedback on this article? Concerned about the content? Get in touch with us directly. Alternatively, email editorial-team (at) simplywallst.com.
About KLSE:CBIP
CB Industrial Product Holding Berhad
An investment holding company, manufactures and sells palm oil mill equipment and related spare parts in Indonesia, Malaysia, Papua New Guinea, Thailand, Central America, Africa, Singapore, Liberia, and internationally.
Excellent balance sheet second-rate dividend payer.
Market Insights

Advertisement
Community Narratives

BMW cruising ahead with new EVs and premium models to boost revenue 5%
Fair Value €135.07|44.5% undervalued
UN
Community Contributor
EU#2 - From Humble Beginnings to Global Powerhouse
Fair Value DKK 851.04|46.1% undervalued
TO
Community Contributor