
Advertisement
- Malaysia
- /
- Industrials
- /
- KLSE:ASB
Take Care Before Jumping Onto Advance Synergy Berhad (KLSE:ASB) Even Though It's 26% Cheaper
Advance Synergy Berhad (KLSE:ASB) shareholders that were waiting for something to happen have been dealt a blow with a 26% share price drop in the last month. The drop over the last 30 days has capped off a tough year for shareholders, with the share price down 29% in that time.
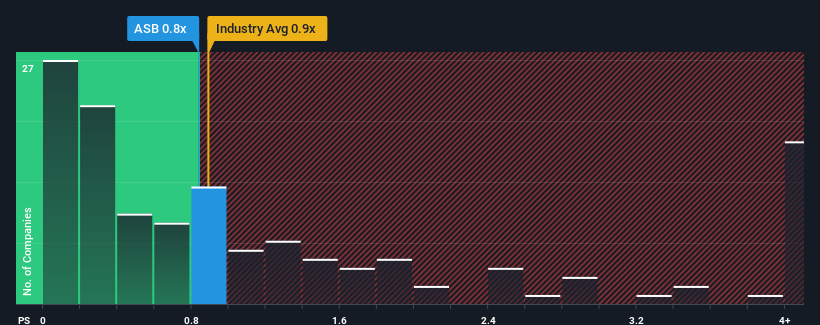
Although its price has dipped substantially, you could still be forgiven for feeling indifferent about Advance Synergy Berhad's P/S ratio of 0.8x, since the median price-to-sales (or "P/S") ratio for the Industrials industry in Malaysia is also close to 0.9x. However, investors might be overlooking a clear opportunity or potential setback if there is no rational basis for the P/S.
View our latest analysis for Advance Synergy Berhad
What Does Advance Synergy Berhad's P/S Mean For Shareholders?
Advance Synergy Berhad certainly has been doing a great job lately as it's been growing its revenue at a really rapid pace. Perhaps the market is expecting future revenue performance to taper off, which has kept the P/S from rising. If you like the company, you'd be hoping this isn't the case so that you could potentially pick up some stock while it's not quite in favour.
Want the full picture on earnings, revenue and cash flow for the company? Then our free report on Advance Synergy Berhad will help you shine a light on its historical performance.Do Revenue Forecasts Match The P/S Ratio?
Advance Synergy Berhad's P/S ratio would be typical for a company that's only expected to deliver moderate growth, and importantly, perform in line with the industry.
Taking a look back first, we see that the company grew revenue by an impressive 55% last year. The strong recent performance means it was also able to grow revenue by 76% in total over the last three years. So we can start by confirming that the company has done a great job of growing revenue over that time.
When compared to the industry's one-year growth forecast of 5.5%, the most recent medium-term revenue trajectory is noticeably more alluring
With this information, we find it interesting that Advance Synergy Berhad is trading at a fairly similar P/S compared to the industry. Apparently some shareholders believe the recent performance is at its limits and have been accepting lower selling prices.
What We Can Learn From Advance Synergy Berhad's P/S?
With its share price dropping off a cliff, the P/S for Advance Synergy Berhad looks to be in line with the rest of the Industrials industry. While the price-to-sales ratio shouldn't be the defining factor in whether you buy a stock or not, it's quite a capable barometer of revenue expectations.
To our surprise, Advance Synergy Berhad revealed its three-year revenue trends aren't contributing to its P/S as much as we would have predicted, given they look better than current industry expectations. When we see strong revenue with faster-than-industry growth, we can only assume potential risks are what might be placing pressure on the P/S ratio. It appears some are indeed anticipating revenue instability, because the persistence of these recent medium-term conditions would normally provide a boost to the share price.
There are also other vital risk factors to consider and we've discovered 3 warning signs for Advance Synergy Berhad (1 makes us a bit uncomfortable!) that you should be aware of before investing here.
Of course, profitable companies with a history of great earnings growth are generally safer bets. So you may wish to see this free collection of other companies that have reasonable P/E ratios and have grown earnings strongly.
New: Manage All Your Stock Portfolios in One Place
We've created the ultimate portfolio companion for stock investors, and it's free.
• Connect an unlimited number of Portfolios and see your total in one currency
• Be alerted to new Warning Signs or Risks via email or mobile
• Track the Fair Value of your stocks
Have feedback on this article? Concerned about the content? Get in touch with us directly. Alternatively, email editorial-team (at) simplywallst.com.
This article by Simply Wall St is general in nature. We provide commentary based on historical data and analyst forecasts only using an unbiased methodology and our articles are not intended to be financial advice. It does not constitute a recommendation to buy or sell any stock, and does not take account of your objectives, or your financial situation. We aim to bring you long-term focused analysis driven by fundamental data. Note that our analysis may not factor in the latest price-sensitive company announcements or qualitative material. Simply Wall St has no position in any stocks mentioned.
About KLSE:ASB
Advance Synergy Berhad
An investment holding company, operates in the property development and investment services in Malaysia, Singapore, Africa, the Middle East, Europe, and internationally.
Excellent balance sheet and good value.
Market Insights

Advertisement
Community Narratives
Quality at a Premium. A time to watch, not to buy?
Fair Value US$154.56|30.1% undervalued
DA
Community Contributor
GRAB: The Super-App at the Heart of Southeast Asia’s Digital Boom
Fair Value US$8.20|25.6% undervalued
BL
Community Contributor
Verve Group to Surge with 51.61% Revenue Growth
Fair Value €6.00|63.2% undervalued
ME
Community Contributor