
Advertisement
- Malaysia
- /
- Auto Components
- /
- KLSE:GIIB
GIIB Holdings Berhad's (KLSE:GIIB) Shares Climb 33% But Its Business Is Yet to Catch Up
GIIB Holdings Berhad (KLSE:GIIB) shares have had a really impressive month, gaining 33% after a shaky period beforehand. But the gains over the last month weren't enough to make shareholders whole, as the share price is still down 5.9% in the last twelve months.
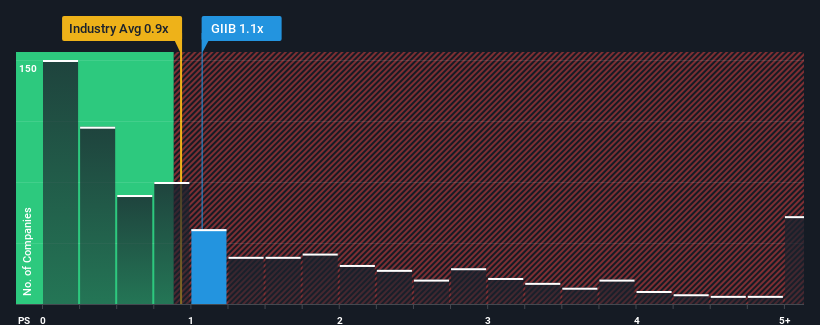
After such a large jump in price, you could be forgiven for thinking GIIB Holdings Berhad is a stock not worth researching with a price-to-sales ratios (or "P/S") of 1.1x, considering almost half the companies in Malaysia's Auto Components industry have P/S ratios below 0.4x. Nonetheless, we'd need to dig a little deeper to determine if there is a rational basis for the elevated P/S.
We've discovered 3 warning signs about GIIB Holdings Berhad. View them for free.See our latest analysis for GIIB Holdings Berhad
How Has GIIB Holdings Berhad Performed Recently?
As an illustration, revenue has deteriorated at GIIB Holdings Berhad over the last year, which is not ideal at all. It might be that many expect the company to still outplay most other companies over the coming period, which has kept the P/S from collapsing. You'd really hope so, otherwise you're paying a pretty hefty price for no particular reason.
We don't have analyst forecasts, but you can see how recent trends are setting up the company for the future by checking out our free report on GIIB Holdings Berhad's earnings, revenue and cash flow.What Are Revenue Growth Metrics Telling Us About The High P/S?
There's an inherent assumption that a company should outperform the industry for P/S ratios like GIIB Holdings Berhad's to be considered reasonable.
Retrospectively, the last year delivered a frustrating 14% decrease to the company's top line. However, a few very strong years before that means that it was still able to grow revenue by an impressive 33% in total over the last three years. Although it's been a bumpy ride, it's still fair to say the revenue growth recently has been more than adequate for the company.
Comparing that to the industry, which is predicted to deliver 13% growth in the next 12 months, the company's momentum is weaker, based on recent medium-term annualised revenue results.
With this in mind, we find it worrying that GIIB Holdings Berhad's P/S exceeds that of its industry peers. It seems most investors are ignoring the fairly limited recent growth rates and are hoping for a turnaround in the company's business prospects. There's a good chance existing shareholders are setting themselves up for future disappointment if the P/S falls to levels more in line with recent growth rates.
What Does GIIB Holdings Berhad's P/S Mean For Investors?
GIIB Holdings Berhad shares have taken a big step in a northerly direction, but its P/S is elevated as a result. Using the price-to-sales ratio alone to determine if you should sell your stock isn't sensible, however it can be a practical guide to the company's future prospects.
The fact that GIIB Holdings Berhad currently trades on a higher P/S relative to the industry is an oddity, since its recent three-year growth is lower than the wider industry forecast. When we observe slower-than-industry revenue growth alongside a high P/S ratio, we assume there to be a significant risk of the share price decreasing, which would result in a lower P/S ratio. Unless there is a significant improvement in the company's medium-term performance, it will be difficult to prevent the P/S ratio from declining to a more reasonable level.
It is also worth noting that we have found 3 warning signs for GIIB Holdings Berhad (2 shouldn't be ignored!) that you need to take into consideration.
Of course, profitable companies with a history of great earnings growth are generally safer bets. So you may wish to see this free collection of other companies that have reasonable P/E ratios and have grown earnings strongly.
New: Manage All Your Stock Portfolios in One Place
We've created the ultimate portfolio companion for stock investors, and it's free.
• Connect an unlimited number of Portfolios and see your total in one currency
• Be alerted to new Warning Signs or Risks via email or mobile
• Track the Fair Value of your stocks
Have feedback on this article? Concerned about the content? Get in touch with us directly. Alternatively, email editorial-team (at) simplywallst.com.
This article by Simply Wall St is general in nature. We provide commentary based on historical data and analyst forecasts only using an unbiased methodology and our articles are not intended to be financial advice. It does not constitute a recommendation to buy or sell any stock, and does not take account of your objectives, or your financial situation. We aim to bring you long-term focused analysis driven by fundamental data. Note that our analysis may not factor in the latest price-sensitive company announcements or qualitative material. Simply Wall St has no position in any stocks mentioned.
About KLSE:GIIB
GIIB Holdings Berhad
An investment holding company, engages in the rubber business in Malaysia, Oceania, Africa, Europe, Middle East, South America, North America, and Rest of Asia.
Low risk with worrying balance sheet.
Market Insights

Advertisement
Weekly Picks
RO


RockeTeller on Santacruz Silver Mining ·
Crazy Undervalued 42 Baggers Silver Play (Active & Running Mine)
Fair Value:CA$8696.7% undervalued
22 followersusers have followed this narrative
6 commentsusers have commented on this narrative
6 likesusers have liked this narrative
RO


Robbo on Fiducian Group ·
Fiducian: Compliance Clouds or Value Opportunity?
Fair Value:AU$126.1% undervalued
3 followersusers have followed this narrative
0 commentsusers have commented on this narrative
0 likesusers have liked this narrative
WO

woodworthfund on Willamette Valley Vineyards ·
Willamette Valley Vineyards (WVVI): Not-So-Great Value
Fair Value:US$242.5% overvalued
5 followersusers have followed this narrative
0 commentsusers have commented on this narrative
1 likeusers have liked this narrative
Recently Updated Narratives
MA


MarkoVT on Alphabet ·
Positioned globally, partnered locally
Fair Value:US$390.1919.1% undervalued
1 followerusers have followed this narrative
0 commentsusers have commented on this narrative
0 likesusers have liked this narrative
JO


JohnJ on Worldline ·
When will fraudsters be investigated in depth. Fraud was ongoing in France too.
Fair Value:€0.5200.8% overvalued
1 followerusers have followed this narrative
0 commentsusers have commented on this narrative
0 likesusers have liked this narrative
MA

MarkoVT on Applied Digital ·
Staggered by dilution; positions for growth
Fair Value:US$35.4520.9% undervalued
5 followersusers have followed this narrative
0 commentsusers have commented on this narrative
0 likesusers have liked this narrative
Popular Narratives
TH


TheWallstreetKing on MicroVision ·
MicroVision will explode future revenue by 380.37% with a vision towards success
Fair Value:US$6098.6% undervalued
112 followersusers have followed this narrative
11 commentsusers have commented on this narrative
22 likesusers have liked this narrative
AN


AnalystConsensusTarget on NVIDIA ·
NVDA: Expanding AI Demand Will Drive Major Data Center Investments Through 2026
Fair Value:US$250.3927.5% undervalued
949 followersusers have followed this narrative
6 commentsusers have commented on this narrative
24 likesusers have liked this narrative
OS

oscargarcia on Alphabet ·
The company that turned a verb into a global necessity and basically runs the modern internet, digital ads, smartphones, maps, and AI.
Fair Value:US$3407.1% undervalued
148 followersusers have followed this narrative
6 commentsusers have commented on this narrative
18 likesusers have liked this narrative

