
Advertisement
- Malaysia
- /
- Auto Components
- /
- KLSE:AFUJIYA
Be Wary Of ABM Fujiya Berhad (KLSE:AFUJIYA) And Its Returns On Capital
If you're looking at a mature business that's past the growth phase, what are some of the underlying trends that pop up? Businesses in decline often have two underlying trends, firstly, a declining return on capital employed (ROCE) and a declining base of capital employed. This combination can tell you that not only is the company investing less, it's earning less on what it does invest. In light of that, from a first glance at ABM Fujiya Berhad (KLSE:AFUJIYA), we've spotted some signs that it could be struggling, so let's investigate.
What Is Return On Capital Employed (ROCE)?
Just to clarify if you're unsure, ROCE is a metric for evaluating how much pre-tax income (in percentage terms) a company earns on the capital invested in its business. To calculate this metric for ABM Fujiya Berhad, this is the formula:
Return on Capital Employed = Earnings Before Interest and Tax (EBIT) ÷ (Total Assets - Current Liabilities)
0.012 = RM2.2m ÷ (RM432m - RM254m) (Based on the trailing twelve months to June 2023).
Thus, ABM Fujiya Berhad has an ROCE of 1.2%. In absolute terms, that's a low return and it also under-performs the Auto Components industry average of 13%.
Check out our latest analysis for ABM Fujiya Berhad
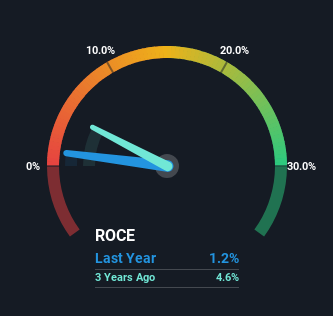
Historical performance is a great place to start when researching a stock so above you can see the gauge for ABM Fujiya Berhad's ROCE against it's prior returns. If you want to delve into the historical earnings, revenue and cash flow of ABM Fujiya Berhad, check out these free graphs here.
How Are Returns Trending?
There is reason to be cautious about ABM Fujiya Berhad, given the returns are trending downwards. About five years ago, returns on capital were 4.1%, however they're now substantially lower than that as we saw above. Meanwhile, capital employed in the business has stayed roughly the flat over the period. Companies that exhibit these attributes tend to not be shrinking, but they can be mature and facing pressure on their margins from competition. So because these trends aren't typically conducive to creating a multi-bagger, we wouldn't hold our breath on ABM Fujiya Berhad becoming one if things continue as they have.
While on the subject, we noticed that the ratio of current liabilities to total assets has risen to 59%, which has impacted the ROCE. If current liabilities hadn't increased as much as they did, the ROCE could actually be even lower. And with current liabilities at these levels, suppliers or short-term creditors are effectively funding a large part of the business, which can introduce some risks.
The Key Takeaway
In summary, it's unfortunate that ABM Fujiya Berhad is generating lower returns from the same amount of capital. Long term shareholders who've owned the stock over the last five years have experienced a 37% depreciation in their investment, so it appears the market might not like these trends either. That being the case, unless the underlying trends revert to a more positive trajectory, we'd consider looking elsewhere.
ABM Fujiya Berhad does have some risks, we noticed 4 warning signs (and 2 which shouldn't be ignored) we think you should know about.
For those who like to invest in solid companies, check out this free list of companies with solid balance sheets and high returns on equity.
New: Manage All Your Stock Portfolios in One Place
We've created the ultimate portfolio companion for stock investors, and it's free.
• Connect an unlimited number of Portfolios and see your total in one currency
• Be alerted to new Warning Signs or Risks via email or mobile
• Track the Fair Value of your stocks
Have feedback on this article? Concerned about the content? Get in touch with us directly. Alternatively, email editorial-team (at) simplywallst.com.
This article by Simply Wall St is general in nature. We provide commentary based on historical data and analyst forecasts only using an unbiased methodology and our articles are not intended to be financial advice. It does not constitute a recommendation to buy or sell any stock, and does not take account of your objectives, or your financial situation. We aim to bring you long-term focused analysis driven by fundamental data. Note that our analysis may not factor in the latest price-sensitive company announcements or qualitative material. Simply Wall St has no position in any stocks mentioned.
About KLSE:AFUJIYA
ABM Fujiya Berhad
An investment holding company, manufactures and sells automotive batteries and batteries for storage and electrical application in Malaysia.
Slight risk with imperfect balance sheet.
Market Insights

Advertisement
Community Narratives
MicroVision will explode future revenue by 380.37% with a vision towards success
Fair Value US$60|98.4% undervalued
TH
Community Contributor
The Indispensable Artery for a New North American Economy
Fair Value CA$132.87|0.7% overvalued
TI
Community Contributor
Recently Updated Narratives
CO

composite32 on Astor Enerji ·
Astor Enerji will surge with a fair value of $140.43 in the next 3 years
Fair Value:₺140.4335.5% undervalued
1 followerusers have followed this narrative
0 commentsusers have commented on this narrative
0 likesusers have liked this narrative
RE

RecMag on Proximus ·
Proximus: The State-Backed Backup Plan with 7% Gross Yield and 15% Currency Upside.
Fair Value:€17.1356.7% undervalued
30 followersusers have followed this narrative
0 commentsusers have commented on this narrative
0 likesusers have liked this narrative
AG


Agricola on IMPACT Silver ·
A case for for IMPACT Silver Corp (TSXV:IPT) to reach USD $4.52 (CAD $6.16) in 2026 (23 bagger in 1 year) and USD $5.76 (CAD $7.89) by 2030
Fair Value:CA$7.8996.2% undervalued
1 followerusers have followed this narrative
0 commentsusers have commented on this narrative
0 likesusers have liked this narrative
Popular Narratives
TH

TheWallstreetKing on MicroVision ·
MicroVision will explode future revenue by 380.37% with a vision towards success
Fair Value:US$6098.4% undervalued
101 followersusers have followed this narrative
10 commentsusers have commented on this narrative
20 likesusers have liked this narrative
OS


oscargarcia on Alphabet ·
The company that turned a verb into a global necessity and basically runs the modern internet, digital ads, smartphones, maps, and AI.
Fair Value:US$3405.8% undervalued
138 followersusers have followed this narrative
6 commentsusers have commented on this narrative
18 likesusers have liked this narrative
AN


AnalystConsensusTarget on NVIDIA ·
NVDA: Expanding AI Demand Will Drive Major Data Center Investments Through 2026
Fair Value:US$250.3929.3% undervalued
930 followersusers have followed this narrative
6 commentsusers have commented on this narrative
23 likesusers have liked this narrative