
Advertisement
- South Korea
- /
- Electronic Equipment and Components
- /
- KOSE:A009150
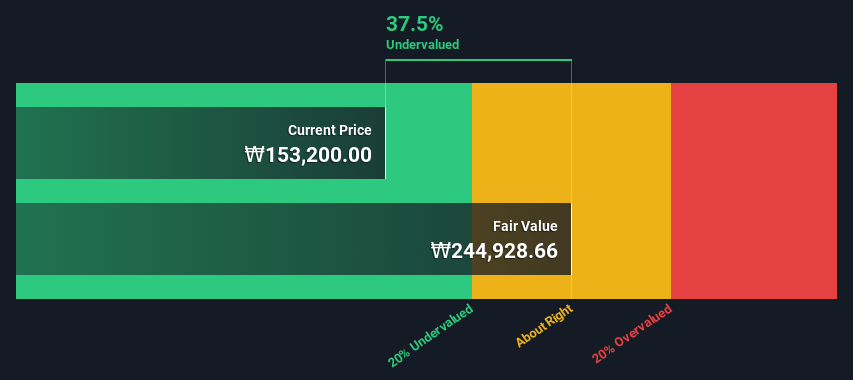
An Intrinsic Calculation For Samsung Electro-Mechanics Co., Ltd. (KRX:009150) Suggests It's 37% Undervalued

Key Insights
- Using the 2 Stage Free Cash Flow to Equity, Samsung Electro-Mechanics fair value estimate is ₩244,929
- Samsung Electro-Mechanics is estimated to be 37% undervalued based on current share price of ₩153,200
- Analyst price target for A009150 is ₩193,793 which is 21% below our fair value estimate
How far off is Samsung Electro-Mechanics Co., Ltd. (KRX:009150) from its intrinsic value? Using the most recent financial data, we'll take a look at whether the stock is fairly priced by taking the expected future cash flows and discounting them to today's value. The Discounted Cash Flow (DCF) model is the tool we will apply to do this. Before you think you won't be able to understand it, just read on! It's actually much less complex than you'd imagine.
We would caution that there are many ways of valuing a company and, like the DCF, each technique has advantages and disadvantages in certain scenarios. If you want to learn more about discounted cash flow, the rationale behind this calculation can be read in detail in the Simply Wall St analysis model.
View our latest analysis for Samsung Electro-Mechanics
The Model
We are going to use a two-stage DCF model, which, as the name states, takes into account two stages of growth. The first stage is generally a higher growth period which levels off heading towards the terminal value, captured in the second 'steady growth' period. In the first stage we need to estimate the cash flows to the business over the next ten years. Where possible we use analyst estimates, but when these aren't available we extrapolate the previous free cash flow (FCF) from the last estimate or reported value. We assume companies with shrinking free cash flow will slow their rate of shrinkage, and that companies with growing free cash flow will see their growth rate slow, over this period. We do this to reflect that growth tends to slow more in the early years than it does in later years.
A DCF is all about the idea that a dollar in the future is less valuable than a dollar today, and so the sum of these future cash flows is then discounted to today's value:
10-year free cash flow (FCF) estimate
| 2024 | 2025 | 2026 | 2027 | 2028 | 2029 | 2030 | 2031 | 2032 | 2033 | |
| Levered FCF (₩, Millions) | ₩522.1b | ₩604.9b | ₩751.7b | ₩957.0b | ₩1.15t | ₩1.29t | ₩1.41t | ₩1.51t | ₩1.60t | ₩1.68t |
| Growth Rate Estimate Source | Analyst x12 | Analyst x13 | Analyst x11 | Analyst x1 | Analyst x1 | Est @ 12.35% | Est @ 9.39% | Est @ 7.32% | Est @ 5.87% | Est @ 4.85% |
| Present Value (₩, Millions) Discounted @ 8.8% | ₩479.9k | ₩511.0k | ₩583.6k | ₩682.8k | ₩752.1k | ₩776.6k | ₩780.8k | ₩770.1k | ₩749.3k | ₩722.0k |
("Est" = FCF growth rate estimated by Simply Wall St)
Present Value of 10-year Cash Flow (PVCF) = ₩6.8t
The second stage is also known as Terminal Value, this is the business's cash flow after the first stage. For a number of reasons a very conservative growth rate is used that cannot exceed that of a country's GDP growth. In this case we have used the 5-year average of the 10-year government bond yield (2.5%) to estimate future growth. In the same way as with the 10-year 'growth' period, we discount future cash flows to today's value, using a cost of equity of 8.8%.
Terminal Value (TV)= FCF2033 × (1 + g) ÷ (r – g) = ₩1.7t× (1 + 2.5%) ÷ (8.8%– 2.5%) = ₩27t
Present Value of Terminal Value (PVTV)= TV / (1 + r)10= ₩27t÷ ( 1 + 8.8%)10= ₩12t
The total value, or equity value, is then the sum of the present value of the future cash flows, which in this case is ₩19t. In the final step we divide the equity value by the number of shares outstanding. Compared to the current share price of ₩153k, the company appears quite good value at a 37% discount to where the stock price trades currently. Valuations are imprecise instruments though, rather like a telescope - move a few degrees and end up in a different galaxy. Do keep this in mind.
Important Assumptions
The calculation above is very dependent on two assumptions. The first is the discount rate and the other is the cash flows. If you don't agree with these result, have a go at the calculation yourself and play with the assumptions. The DCF also does not consider the possible cyclicality of an industry, or a company's future capital requirements, so it does not give a full picture of a company's potential performance. Given that we are looking at Samsung Electro-Mechanics as potential shareholders, the cost of equity is used as the discount rate, rather than the cost of capital (or weighted average cost of capital, WACC) which accounts for debt. In this calculation we've used 8.8%, which is based on a levered beta of 1.189. Beta is a measure of a stock's volatility, compared to the market as a whole. We get our beta from the industry average beta of globally comparable companies, with an imposed limit between 0.8 and 2.0, which is a reasonable range for a stable business.
SWOT Analysis for Samsung Electro-Mechanics
Strength
- Debt is not viewed as a risk.
- Dividends are covered by earnings and cash flows.
Weakness
- Earnings declined over the past year.
- Dividend is low compared to the top 25% of dividend payers in the Electronic market.
Opportunity
- Annual earnings are forecast to grow for the next 3 years.
- Trading below our estimate of fair value by more than 20%.
Threat
- Annual earnings are forecast to grow slower than the South Korean market.
Moving On:
Valuation is only one side of the coin in terms of building your investment thesis, and it ideally won't be the sole piece of analysis you scrutinize for a company. It's not possible to obtain a foolproof valuation with a DCF model. Instead the best use for a DCF model is to test certain assumptions and theories to see if they would lead to the company being undervalued or overvalued. If a company grows at a different rate, or if its cost of equity or risk free rate changes sharply, the output can look very different. Why is the intrinsic value higher than the current share price? For Samsung Electro-Mechanics, we've put together three fundamental items you should look at:
- Risks: Be aware that Samsung Electro-Mechanics is showing 1 warning sign in our investment analysis , you should know about...
- Future Earnings: How does A009150's growth rate compare to its peers and the wider market? Dig deeper into the analyst consensus number for the upcoming years by interacting with our free analyst growth expectation chart.
- Other Solid Businesses: Low debt, high returns on equity and good past performance are fundamental to a strong business. Why not explore our interactive list of stocks with solid business fundamentals to see if there are other companies you may not have considered!
PS. Simply Wall St updates its DCF calculation for every South Korean stock every day, so if you want to find the intrinsic value of any other stock just search here.
New: Manage All Your Stock Portfolios in One Place
We've created the ultimate portfolio companion for stock investors, and it's free.
• Connect an unlimited number of Portfolios and see your total in one currency
• Be alerted to new Warning Signs or Risks via email or mobile
• Track the Fair Value of your stocks
Have feedback on this article? Concerned about the content? Get in touch with us directly. Alternatively, email editorial-team (at) simplywallst.com.
This article by Simply Wall St is general in nature. We provide commentary based on historical data and analyst forecasts only using an unbiased methodology and our articles are not intended to be financial advice. It does not constitute a recommendation to buy or sell any stock, and does not take account of your objectives, or your financial situation. We aim to bring you long-term focused analysis driven by fundamental data. Note that our analysis may not factor in the latest price-sensitive company announcements or qualitative material. Simply Wall St has no position in any stocks mentioned.
About KOSE:A009150
Samsung Electro-Mechanics
Manufactures and sells various electronic components in Korea, China, Southeast Asia, Japan, the Americas, and Europe.
Flawless balance sheet with proven track record and pays a dividend.
Similar Companies
Market Insights

Advertisement
Community Narratives
The Most Undervalued of the Magnificent 7
Fair Value US$237.43|37.8% undervalued
IN
Community Contributor
CSL is undervalued in High Tax Scenario
Fair Value AU$263.33|10.2% undervalued
RA
Community Contributor
PVA TePla's New Strategy Aims for 22% Revenue Growth in Semiconductor Recovery
Fair Value €19.19|20.8% undervalued
MI
Community Contributor