
Advertisement
- South Korea
- /
- Electronic Equipment and Components
- /
- KOSE:A006400
Even With A 28% Surge, Cautious Investors Are Not Rewarding Samsung SDI Co., Ltd.'s (KRX:006400) Performance Completely
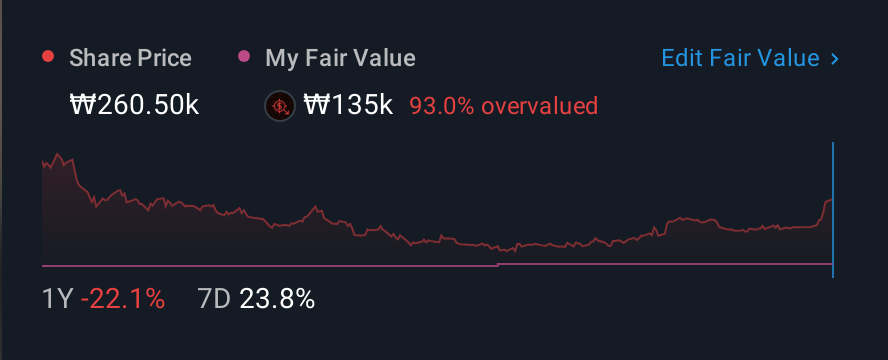
Samsung SDI Co., Ltd. (KRX:006400) shareholders have had their patience rewarded with a 28% share price jump in the last month. Not all shareholders will be feeling jubilant, since the share price is still down a very disappointing 30% in the last twelve months.
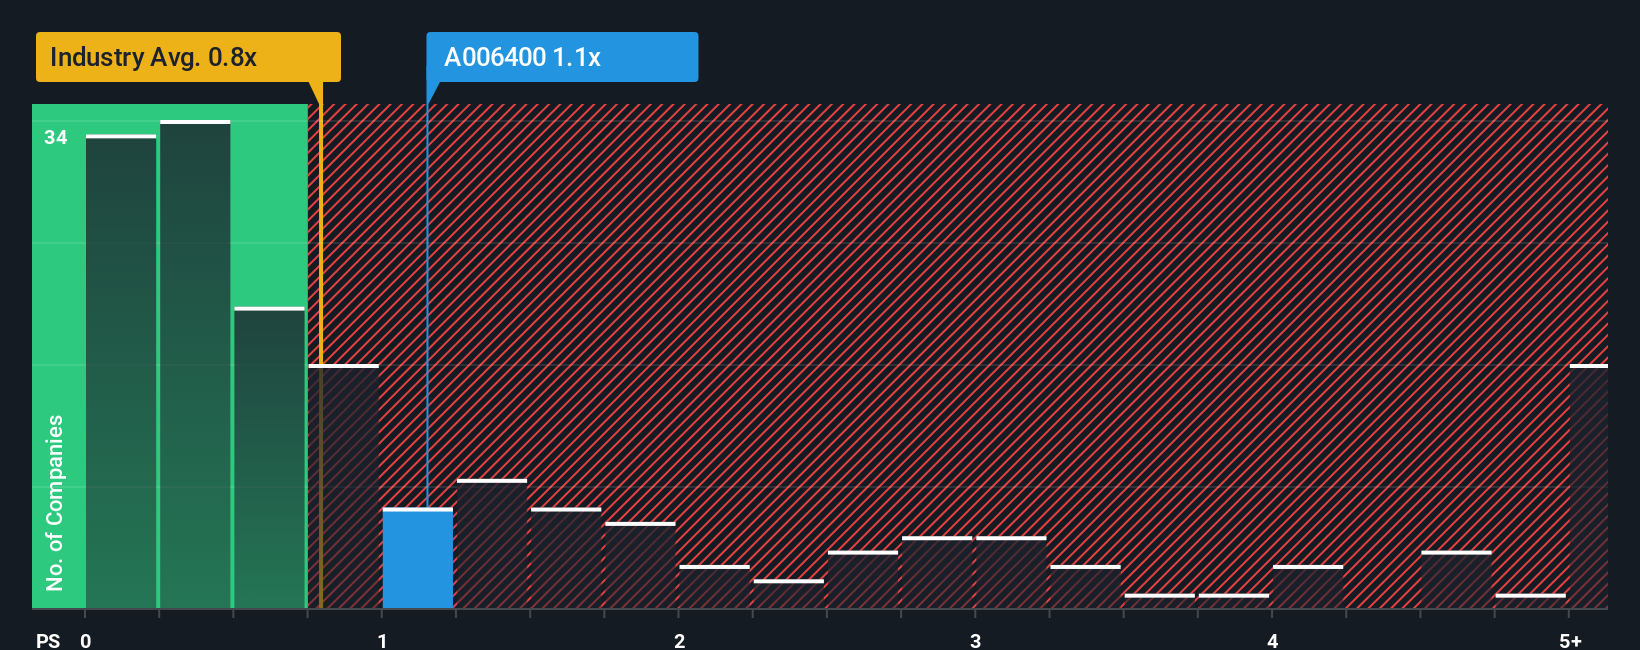
Although its price has surged higher, there still wouldn't be many who think Samsung SDI's price-to-sales (or "P/S") ratio of 1.1x is worth a mention when the median P/S in Korea's Electronic industry is similar at about 0.8x. While this might not raise any eyebrows, if the P/S ratio is not justified investors could be missing out on a potential opportunity or ignoring looming disappointment.
See our latest analysis for Samsung SDI
How Has Samsung SDI Performed Recently?
Samsung SDI hasn't been tracking well recently as its declining revenue compares poorly to other companies, which have seen some growth in their revenues on average. Perhaps the market is expecting its poor revenue performance to improve, keeping the P/S from dropping. If not, then existing shareholders may be a little nervous about the viability of the share price.
If you'd like to see what analysts are forecasting going forward, you should check out our free report on Samsung SDI.How Is Samsung SDI's Revenue Growth Trending?
In order to justify its P/S ratio, Samsung SDI would need to produce growth that's similar to the industry.
Retrospectively, the last year delivered a frustrating 28% decrease to the company's top line. This has erased any of its gains during the last three years, with practically no change in revenue being achieved in total. So it appears to us that the company has had a mixed result in terms of growing revenue over that time.
Turning to the outlook, the next three years should generate growth of 14% per annum as estimated by the analysts watching the company. Meanwhile, the rest of the industry is forecast to only expand by 12% per year, which is noticeably less attractive.
In light of this, it's curious that Samsung SDI's P/S sits in line with the majority of other companies. It may be that most investors aren't convinced the company can achieve future growth expectations.
What Does Samsung SDI's P/S Mean For Investors?
Its shares have lifted substantially and now Samsung SDI's P/S is back within range of the industry median. It's argued the price-to-sales ratio is an inferior measure of value within certain industries, but it can be a powerful business sentiment indicator.
Despite enticing revenue growth figures that outpace the industry, Samsung SDI's P/S isn't quite what we'd expect. There could be some risks that the market is pricing in, which is preventing the P/S ratio from matching the positive outlook. It appears some are indeed anticipating revenue instability, because these conditions should normally provide a boost to the share price.
There are also other vital risk factors to consider and we've discovered 4 warning signs for Samsung SDI (2 are a bit unpleasant!) that you should be aware of before investing here.
If these risks are making you reconsider your opinion on Samsung SDI, explore our interactive list of high quality stocks to get an idea of what else is out there.
New: Manage All Your Stock Portfolios in One Place
We've created the ultimate portfolio companion for stock investors, and it's free.
• Connect an unlimited number of Portfolios and see your total in one currency
• Be alerted to new Warning Signs or Risks via email or mobile
• Track the Fair Value of your stocks
Have feedback on this article? Concerned about the content? Get in touch with us directly. Alternatively, email editorial-team (at) simplywallst.com.
This article by Simply Wall St is general in nature. We provide commentary based on historical data and analyst forecasts only using an unbiased methodology and our articles are not intended to be financial advice. It does not constitute a recommendation to buy or sell any stock, and does not take account of your objectives, or your financial situation. We aim to bring you long-term focused analysis driven by fundamental data. Note that our analysis may not factor in the latest price-sensitive company announcements or qualitative material. Simply Wall St has no position in any stocks mentioned.
About KOSE:A006400
Samsung SDI
Manufactures and sells batteries in South Korea, Europe, China, North America, Southeast Asia, and internationally.
Reasonable growth potential with mediocre balance sheet.
Similar Companies
Market Insights

Advertisement
Weekly Picks
RO


RockeTeller on Santacruz Silver Mining ·
Crazy Undervalued 42 Baggers Silver Play (Active & Running Mine)
Fair Value:CA$8696.7% undervalued
75 followersusers have followed this narrative
7 commentsusers have commented on this narrative
21 likesusers have liked this narrative
RO


Robbo on Fiducian Group ·
Fiducian: Compliance Clouds or Value Opportunity?
Fair Value:AU$121.2% undervalued
13 followersusers have followed this narrative
0 commentsusers have commented on this narrative
1 likeusers have liked this narrative
WO

woodworthfund on Willamette Valley Vineyards ·
Willamette Valley Vineyards (WVVI): Not-So-Great Value
Fair Value:US$245.0% overvalued
11 followersusers have followed this narrative
0 commentsusers have commented on this narrative
1 likeusers have liked this narrative
Recently Updated Narratives
NO

Norms70 on Standard Lithium ·
SLI is share to watch next 5 years
Fair Value:€4.59.8% undervalued
1 followerusers have followed this narrative
0 commentsusers have commented on this narrative
0 likesusers have liked this narrative
DA


davidlsander on Beam Therapeutics ·
The "Molecular Pencil": Why Beam's Technology is Built to Win
Fair Value:US$15081.9% undervalued
61 followersusers have followed this narrative
3 commentsusers have commented on this narrative
0 likesusers have liked this narrative
RE

RedhawkCC on Prime Medicine ·
PRME remains a long shot but publication in the New England Journal of Medicine helps.
Fair Value:US$0.0469.1k% overvalued
1 followerusers have followed this narrative
0 commentsusers have commented on this narrative
0 likesusers have liked this narrative
Popular Narratives
TH


TheWallstreetKing on MicroVision ·
MicroVision will explode future revenue by 380.37% with a vision towards success
Fair Value:US$6098.5% undervalued
118 followersusers have followed this narrative
11 commentsusers have commented on this narrative
22 likesusers have liked this narrative
AN


AnalystConsensusTarget on NVIDIA ·
NVDA: Expanding AI Demand Will Drive Major Data Center Investments Through 2026
Fair Value:US$250.3925.9% undervalued
962 followersusers have followed this narrative
6 commentsusers have commented on this narrative
25 likesusers have liked this narrative
RO
RockeTeller on Santacruz Silver Mining ·
Crazy Undervalued 42 Baggers Silver Play (Active & Running Mine)
Fair Value:CA$8696.7% undervalued
75 followersusers have followed this narrative
7 commentsusers have commented on this narrative
21 likesusers have liked this narrative
